Figure 2.

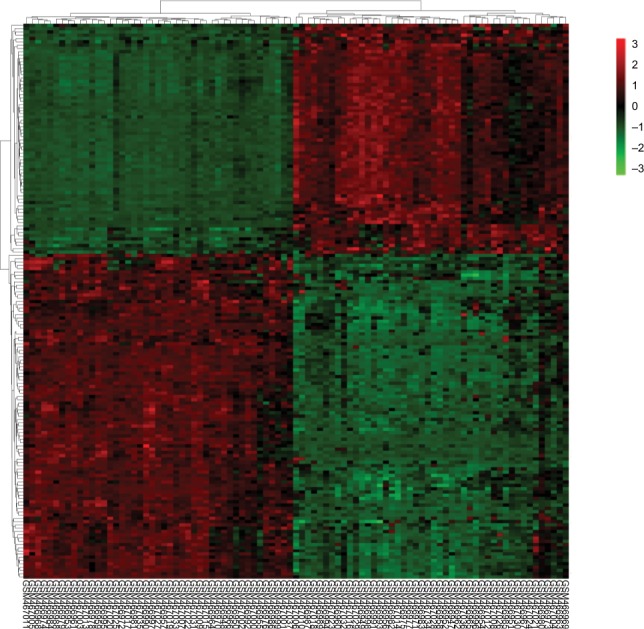
Heatmap plot of the 169 overlapped DEGs between lung cancer and normal samples in dataset GSE18842.
Notes: Red represents higher expression and green represents lower expression.
Abbreviation: DEGs, differentially expressed genes.

Heatmap plot of the 169 overlapped DEGs between lung cancer and normal samples in dataset GSE18842.
Notes: Red represents higher expression and green represents lower expression.
Abbreviation: DEGs, differentially expressed genes.