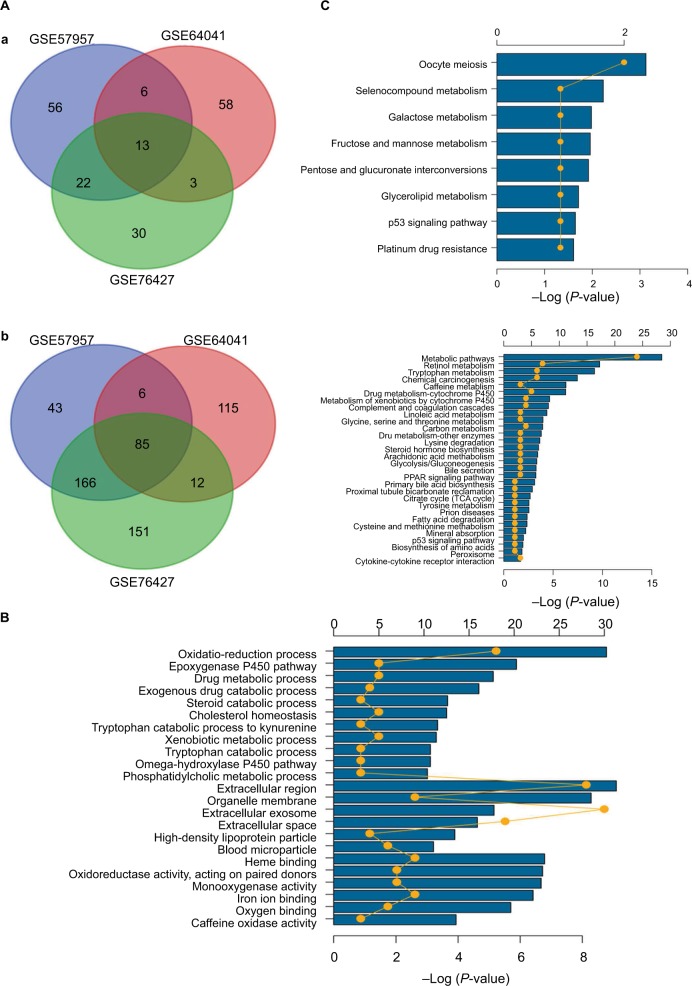
Figure 3.
Gene oncology and KEGG pathway enrichment analysis of intersection mRNAs.
Notes: (A) Venn diagram analysis of DEGs in comparison groups (a) upregulated DEGs and (b) downregulated DEGs. (B) Gene oncology analysis of downregulated intersection DEGs. (C) KEGG pathway enrichment analysis of upregulated and downregulated intersection DEGs.
Abbreviations: DEGs, differentially expressed genes; KEGG, Kyoto Encyclopedia of Genes and Genomes.

