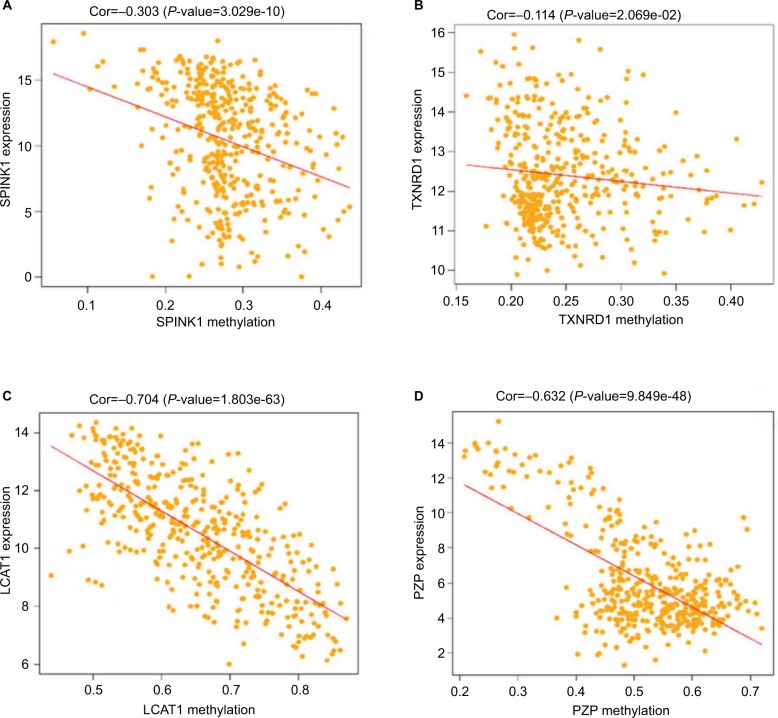
Figure 8.
Correlation analysis between the expression of SPINK1, TXNRD1, LCAT, and PZP and their methylation.
Notes: (A) The correlation analysis between SPINK1 and methylation. (B) The correlation analysis between TXNRD1 and methylation. (C) The correlation analysis between LCAT and methylation. (D) The correlation analysis between PZP and methylation.
Abbreviations: Cor, correlation; TCGA, The Cancer Genome Atlas project.

