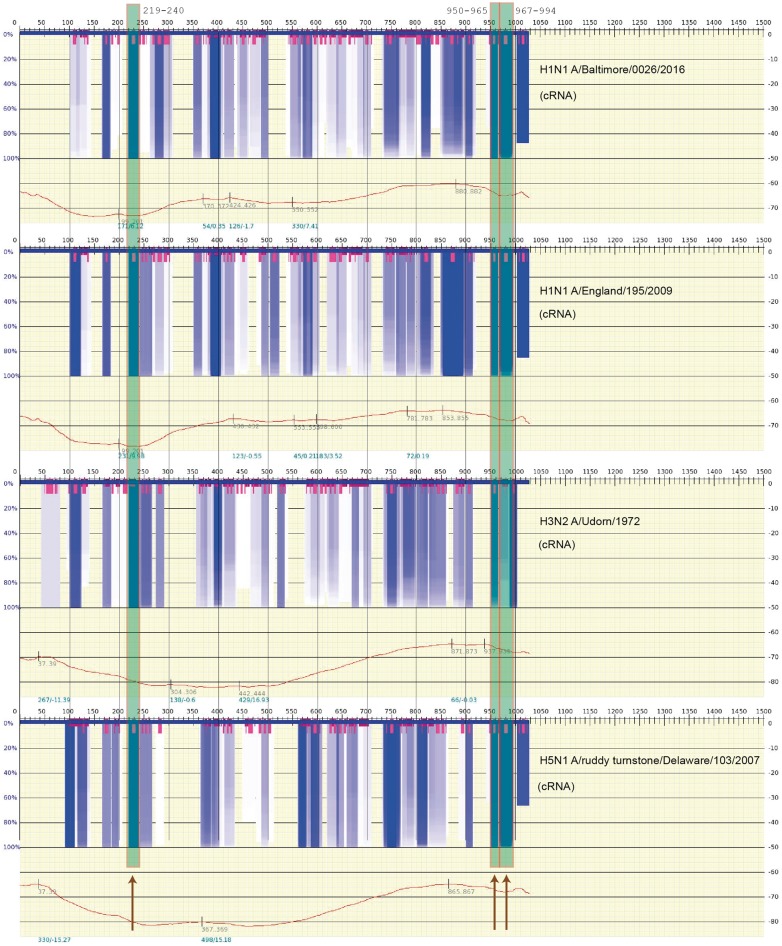
Figure 3.
A scan of the thermodynamic stability of the cRNA secondary structure (variability of the structures) for the influenza A viral genome (M, Segment 7) where the largely universally conserved segments reported in [87] are indicated by the long semitransparent gray/green boxes (also marked by dark arrows, bottom). The graph spectrum was generated using Genepoem [90] and calculated using vs_subopt/vswindow [89] using default settings (window size 200 nt, Kuhn length 4 nt). The very dark gray/blue boxes indicate regions of highly stable RNA secondary structure (not only hairpins but even a region of stability). The very short gray/magenta boxes indicate regions where a stable loop is present. The particular strains that were calculated are shown on the right side of each free energy spectrum. The sequences were obtained from the influenza database at https://www.fludb.org [88]. (A colour version of this figure is available online at: https://academic.oup.com/bfg)

