Figure 2.
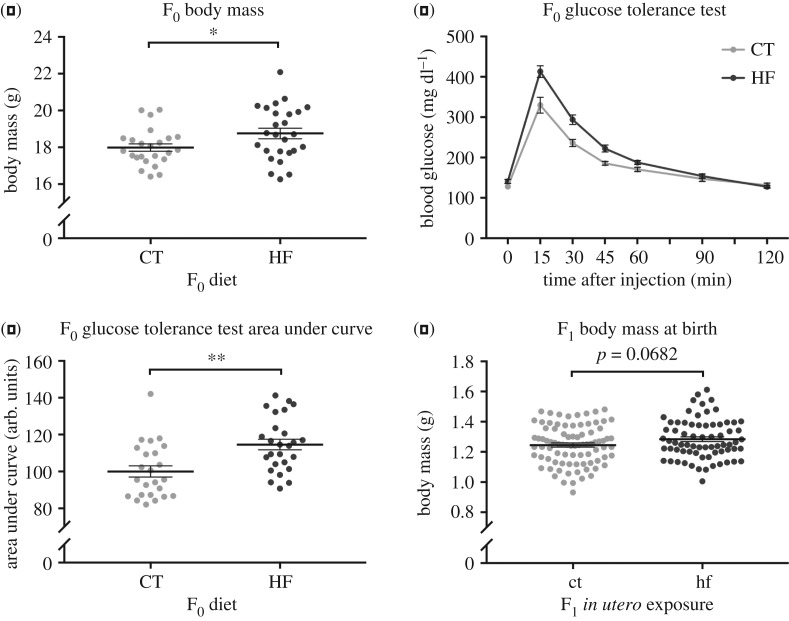
Effects of diet on F0 and F1 body mass, and F0 glucose homeostasis. (a) Body mass of F0 dams prior to mating, after consuming CT or HF diets for six weeks. (b) Glucose tolerance test of F0 dams at the same time point as described for (a). (c) Quantification of the area under the curve in (b). (d) Body mass of F1 pups on the day of birth after in utero exposure to a maternal control (ct) or high-fat (hf) diet. Individual data points are shown for (a), (c), and (d), with horizontal black lines representing means and error bars representing standard error. Data in (b) are presented as mean ± s.e. *p < 0.05, **p < 0.005; Student's t-test, two-tailed.

