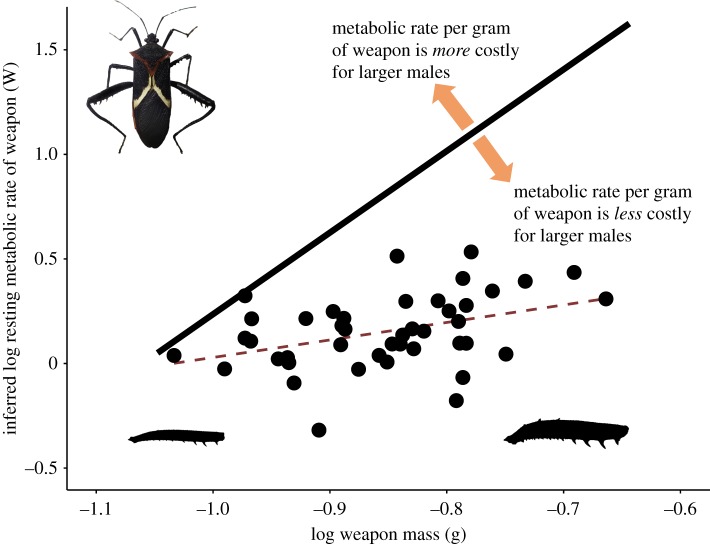
Figure 4.
To visualize the prediction that weapon mass scales in direct proportion to metabolic rate, we constructed a line that depicts an equivalent metabolic rate for every gram of weapon mass (hypothesis 1, isometry; solid black line, slope = 1). Our results (red dashed line) fall below this prediction, showing that the inferred metabolic rate per gram of tissue lost is lower than predicted if weapons cost the same for large and small males. (Test against isometry: OLS against slope = 1: F1,41 = 4.71, p = 0.036. Test against typical allometry: OLS against slope = 0.75, F1,41 = 4.70, p = 0.024, n = 43). These findings suggest that larger males pay a lower cost per gram to maintain their weapons. Each point represents inferred metabolic rate of a single hind leg from measured values of each individual male. (Online version in colour.)

