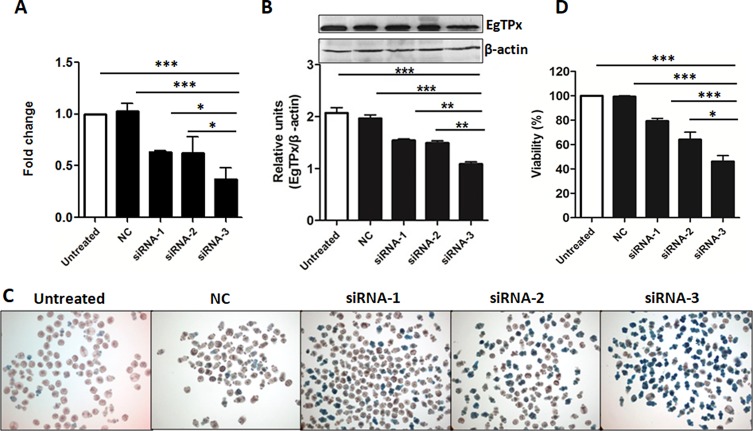
Figure 3.
RNAi effects on EgTPx expression and viability of cultured protoscoleces. (A) Quantitative PCR analysis of EgTPx mRNA in siRNA-1/2/3-treated or untreated protoscoleces. (B) Western blotting analysis and quantification graph of EgTPx protein expression in siRNA-1/2/3-treated or untreated protoscoleces. (C), (D) RNAi effects on the viability of siRNA-treated protoscoleces under oxidative stress (H2O2, 0.6 mM, 1 h) by day 3. Bars represent the standard deviation. *p < 0.05; **p < 0.01; ***p < 0.001.

