Figure 1.
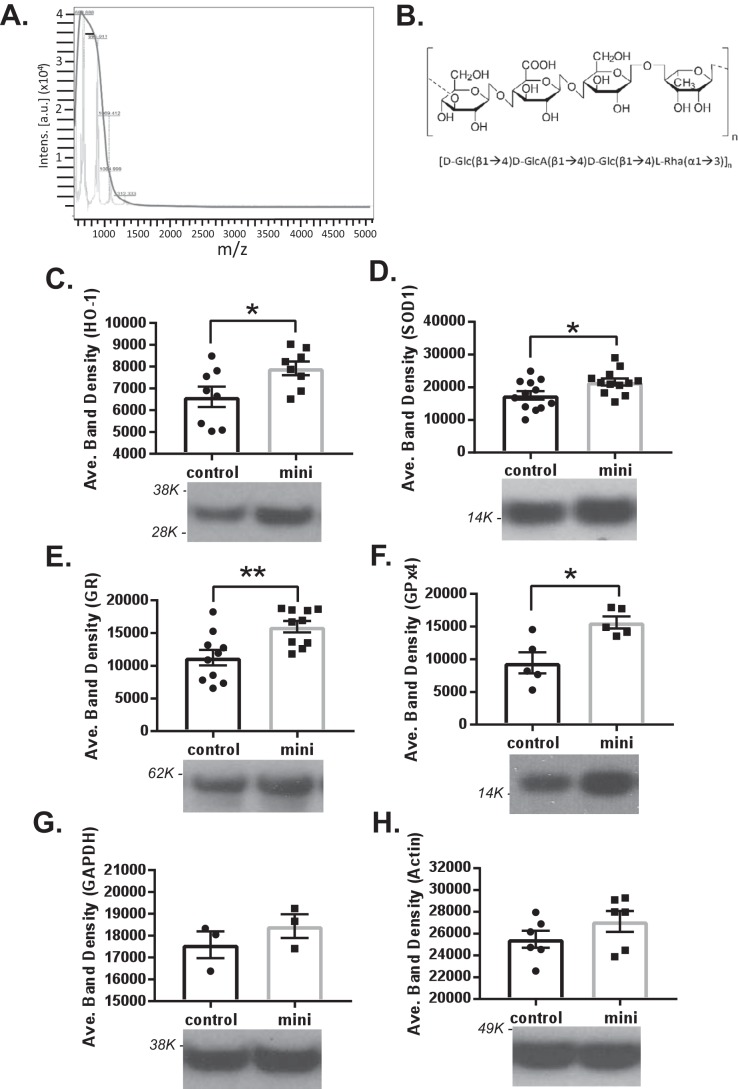
Mass spectrometry of mini-GAGR and its effect on antioxidant enzyme proteins in mouse cortical neurons. A, mass spectrum of mini-GAGR. MALDI-MS shows the molecular mass (∼720 Da) of mini-GAGR. B, basic structure of mini-GAGR. C–H, mouse cortical neurons (E17, DIV11–14) were treated with either vehicle (control) or 1 μm mini-GAGR (mini) for 48 h and processed for immunoblotting using antibodies to antioxidant enzymes and GAPDH and β-actin (loading control). The band densities of the proteins were quantified by ImageJ to obtain average band density ± S.E. (error bars) for the bar graphs. C, HO1 (32 kDa) (p = 0.0364, n = 8 different embryo batches); D, SOD1 (16 kDa) (p = 0.0243, n = 12 different embryo batches); E, GR (60 kDa) (p = 0.00515, n = 10 different embryo batches); F, GPx4 (21 kDa) (p = 0.0103, n = 5 different embryo batches) compared with control. There were no statistically significantly differences in the protein levels of GAPDH (37 kDa) and β-actin (45 kDa) in mini-GAGR–treated neurons compared with control (*, p < 0.05; **, p < 0.01; unpaired t test, two-tailed). Data are expressed as mean ± S.E. Each molecular mass marker is marked beside each blot (e.g. 98K indicates 98,000 Da).

