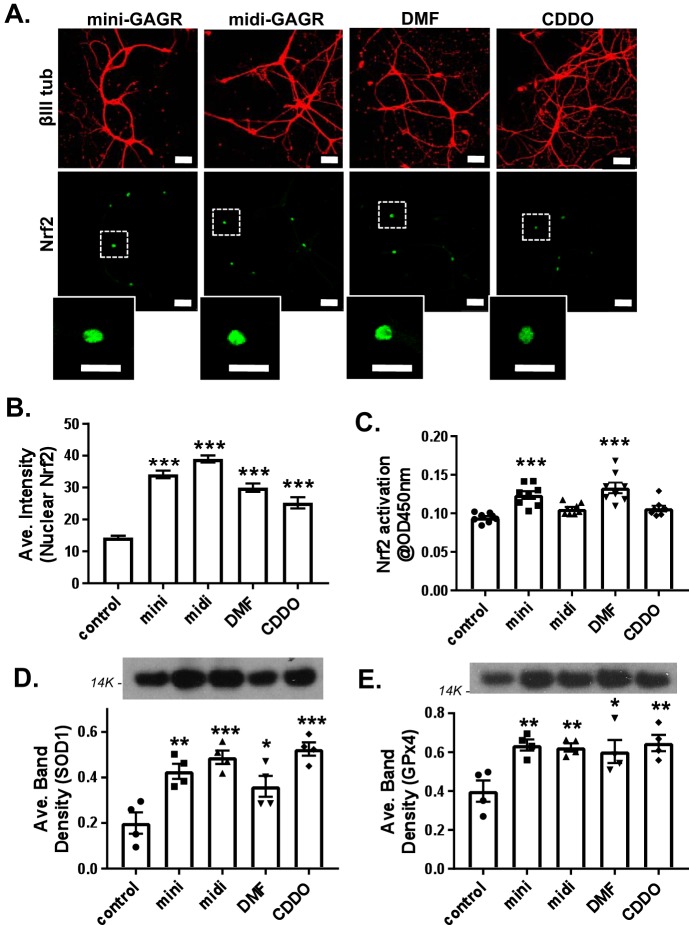
Figure 3.
Comparison of mini-GAGR with other Nrf2 activators. A, mouse cortical neurons (E17, DIV11–14) were treated with vehicle (control), 1 μm mini-GAGR, 1 μm midi-GAGR, 6 μg/ml DMF, or 100 nm CDDO-TFEA for 3 h and processed for immunocytochemistry with antibodies against Nrf2 (green; Alexa Fluor 488), βIII tubulin (red; Alexa Fluor 594), and DAPI (not shown) (scale bar, 30 μm). The insets show each representative nuclear Nrf2 staining. B, the fluorescence intensities of nuclear Nrf2 in images were quantified using Metamorph to calculate the average intensity ± S.E. (error bars) for bar graphs (n = 76–80 nuclei): control versus mini-GAGR, midi-GAGR, DMF, and CDDO (p < 0.001) (F (4, 509) = 87.888, p < 0.001, ANOVA). (Of note, because the total number of measurements per condition was too large for a scatter plot, bar graphs were used instead.) C, the transcriptional factor activity of Nrf2 was measured via absorbance at 450 nm at 3 h after the treatment with vehicle (control), 1 μm mini-GAGR, 1 μm midi-GAGR, 6 μg/ml DMF, or 100 nm CDDO-TFEA. Bar graphs, control versus mini-GAGR and control versus DMF (n = 8 different embryo batches, p < 0.001) (F(4, 35) = 12.668, p < 0.001, ANOVA). D and E, mouse primary cortical neurons (E17, DIV11–14) were treated with vehicle (control), 1 μm mini-GAGR, 1 μm midi-GAGR, 6 μg/ml DMF, or 100 nm CDDO-TFEA for 48 h and processed for immunoblotting using antibodies to SOD1 (16 kDa) and GPx4 (21 kDa). The band densities of the proteins were quantified by ImageJ to obtain average band density ± S.E. for the bar graphs. D, SOD1 (n = 4 different embryo batches): control versus mini-GAGR (p = 0.003), control versus midi (p < 0.001), control versus DMF (p = 0.034), and control versus CDDO-TFEA (p < 0.001) (F(4, 15) = 11.566, p < 0.001, ANOVA). E, GPx4 (n = 4 different embryo batches): control versus mini-GAGR (p = 0.007), control versus midi-GAGR (p = 0.010), control versus DMF (p = 0.020), control versus CDDO-TFEA (p = 0.005) (F(4, 15) = 5.5698, p = 0.006, ANOVA). (*, p < 0.05; **, p < 0.01; ***, p < 0.001, one-way ANOVA and Bonferroni's multiple-comparison test.) Data are expressed as mean ± S.E.

