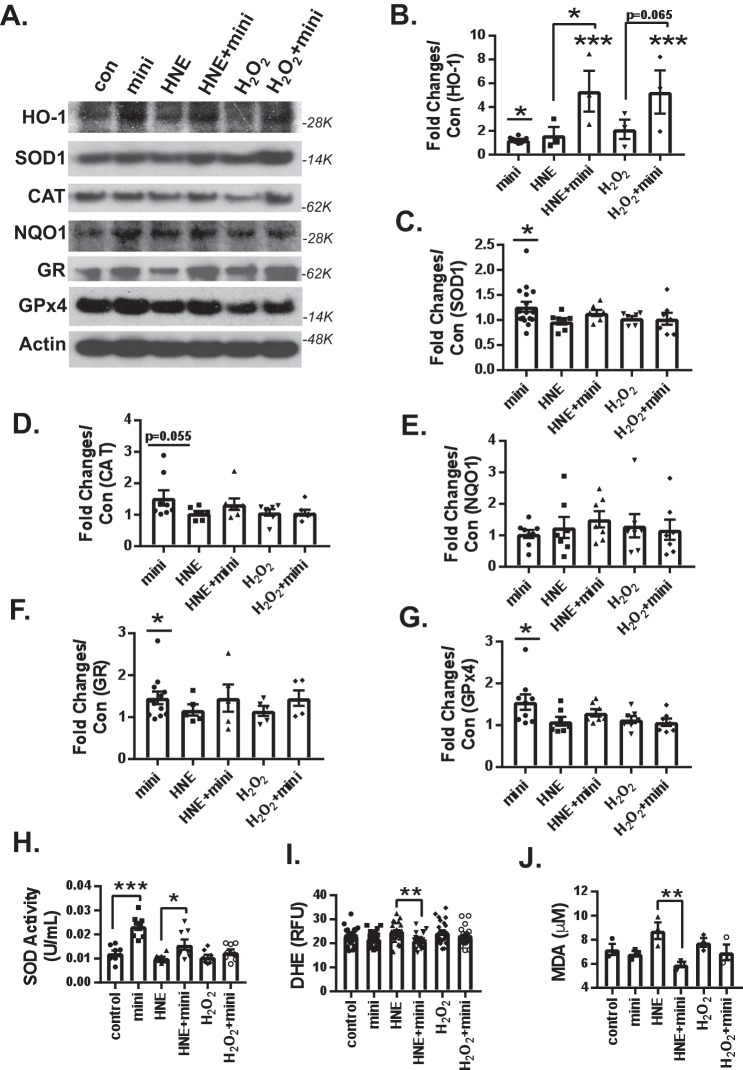
Figure 4.
Mini-GAGR increases the protein level of HO-1 and the enzymatic activity of SOD and reduces 4HNE-induced oxidative stress in neurons under oxidative stress. A, mouse cortical neurons (E17, DIV11–14) were pretreated with either vehicle or 1 μm mini-GAGR for 16 h and treated with vehicle, 10 μm 4HNE, or 50 μm H2O2 for 30 h prior to immunoblotting, enzyme assays, and free radical measurement. The band densities of antioxidant enzyme proteins were quantified by ImageJ to obtain average density ± S.E. (error bars). The average density of each protein in control conditions was used to calculate -fold differences of the protein in different conditions. B, HO-1 (4HNE versus HNE + mini: p = 0.038, n = 3 different embryo batches). There were statistically significant differences in protein levels between control and mini-GAGR for HO-1 (p = 0.034, n = 7 different embryo batches (F(4, 15) = 5.1797, p = 0.008, ANOVA)) (B), SOD (p = 0.044, n = 7 different embryo batches (F(4, 39) = 1.7323, p = 0.162, ANOVA)) (C), CAT (trending, p = 0.055, n = 7 different embryo batches (F(4, 31) = 1.887, p = 0.138, ANOVA)) (D), GR (p = 0.022, n = 7 different embryo batches) (F), and GPx4 (p = 0.022, n = 5 different embryo batches) (G). There were no statistically significant differences in protein levels between free radical alone (4HNE (HNE) or H2O2) and free radical plus mini-GAGR for SOD (n = 7 different embryo batches) (C), CAT (n = 7 different embryo batches) (D), NQO1 (n = 7 different embryo batches (F(4, 31) = 0.36323, p = 0.833, ANOVA)) (E), GR (n = 7 different embryo batches (F(4, 27) = 0.64436, p = 0.636, ANOVA)) (F), and GPx4 (n = 5 different embryo batches (F(4, 32) = 2.7775, p = 0.044, ANOVA)) (G). H, SOD activity (units/ml) (n = 8 different embryo batches): control versus mini-GAGR (p < 0.001), HNE versus HNE + mini-GAGR (p = 0.028) (F(5, 42) = 13.466, p < 0.001, ANOVA). I, ROS level (HNE versus HNE + mini-GAGR: p = 0.006, n = 24 different embryo batches (F(5, 138) = 3.496, p = 0.005, ANOVA)). J, MDA level (HNE versus HNE + mini-GAGR: p = 0.006, n = 3 different embryo batches (F(5, 12) = 3.989, p = 0.023, ANOVA)). (*, p < 0.05; **, p < 0.01; ***, p < 0.001, one-way ANOVA and Bonferroni's multiple-comparison test). Data are expressed as mean ± S.E.

