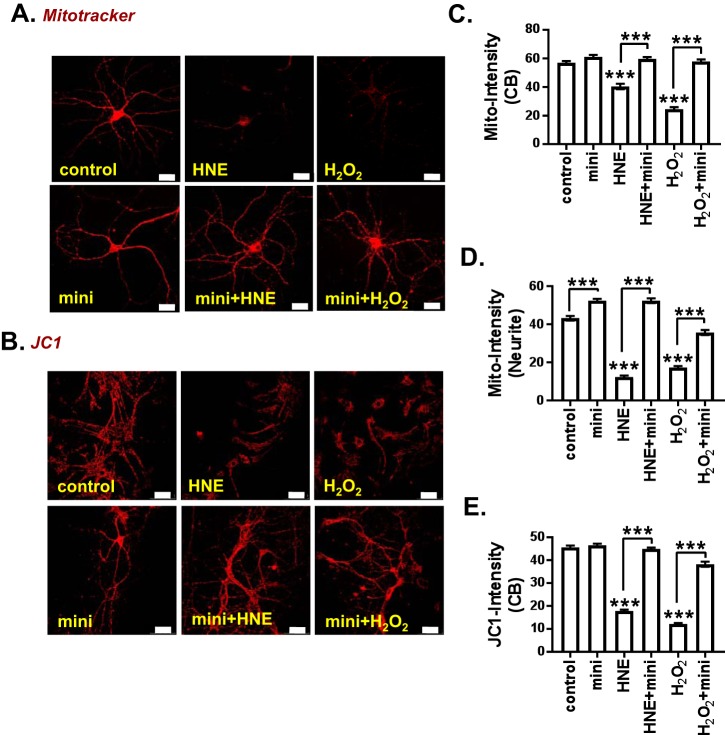
Figure 5.
Mini-GAGR protects mitochondria and MMP from oxidative stress. A, mouse cortical neurons (E17, DIV11–14) were pretreated with either vehicle (control) or 1 μm mini-GAGR (mini) for 16 h and treated with vehicle, 10 μm 4HNE (HNE), or 50 μm H2O2 for 30 h prior to MitoTracker (A) or JC-1 (B) staining. The intensities of MitoTracker in the cell body (CB) (C) and neurites (D) of fixed neurons were quantified by Metamorph software. C, average intensity ± S.E. (error bars) of MitoTracker staining in cell body (n = 100 cell bodies): control versus HNE (p < 0.001), control versus H2O2 (p < 0.001), HNE versus HNE + mini-GAGR (p < 0.001), H2O2 versus H2O2 + mini-GAGR (p < 0.001) (F(5, 638) = 115.97; p < 0.001, ANOVA). D, average intensity ± S.E. of MitoTracker in neurites (n = 120 neurites): control versus mini-GAGR (p < 0.001), control versus HNE (p < 0.001), control versus H2O2 (p < 0.001), HNE versus HNE + mini-GAGR (p < 0.001), H2O2 versus H2O2 + mini-GAGR (p < 0.001) (F(5, 746) = 241.14; p < 0.001, ANOVA). E, JC-1 (n = 200 cell bodies): control versus HNE (p < 0.001), control versus H2O2 (p < 0.001), HNE versus HNE + mini-GAGR (p < 0.001), H2O2 versus H2O2 + mini-GAGR (p < 0.001) (F(5, 1428) = 445.69; p < 0.001, ANOVA). ***, p < 0.001, one-way ANOVA and Bonferroni's multiple-comparison test; scale bar, 30 μm). Data are expressed as mean ± S.E. (Of note, because the total number of measurements per condition was over 100, scatter plots were not used for bar graphs.)

