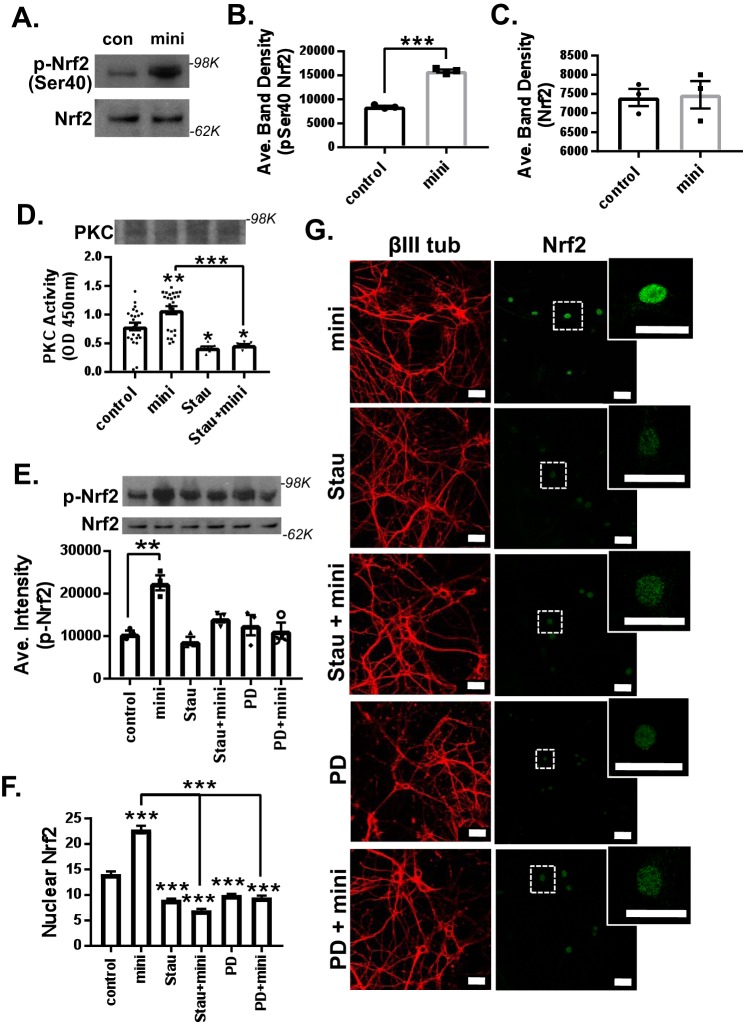
Figure 7.
Mini-GAGR induces phosphorylation and nuclear localization of Nrf2 in a PKC- and FGFR1-dependent manner. A, mouse cortical neurons (E17, DIV14) were treated with 1 μm mini-GAGR (mini) for 3 h and processed for immunoblotting (p-Ser-40-Nrf2 and Nrf2). The band densities of phospho-Nrf2 (100 kDa) (B) and total Nrf2 (80 kDa) (C) were quantified by ImageJ to obtain average density ± S.E. (error bars) of p-Nrf2 (p < 0.001, n = 3 different embryo batches), Nrf2 protein concentration (n = 3 different embryo batches) (Student's t test, two-tailed). D, primary cortical neurons (E17, DIV14) were pretreated with either vehicle or 3 nm Stau (PKC inhibitor) for 2 h and treated with either vehicle (control) or 1 μm mini-GAGR for 3 h prior to the measurement of PKC activity (n = 8 different embryo batches): control versus mini-GAGR (mini) (p = 0.008), control versus Stau (p = 0.017), control versus Stau + mini-GAGR (p = 0.047), mini-GAGR versus Stau + mini-GAGR (p < 0.001) (one-way ANOVA (F(3, 60) = 14.631, p < 0.001, ANOVA, and Bonferroni's multiple-comparison test). E–G, primary cortical neurons (E17, DIV14) were pretreated with vehicle, 3 nm staurosporine, or 50 nm PD173074 (FGFR1 inhibitor) for 2 h and treated with 1 μm mini-GAGR for 3 h prior to immunoblotting (p-Nrf2 and Nrf2). E, the band densities of antioxidant enzyme proteins were quantified by ImageJ to obtain average density ± S.E. for bar graphs: control versus mini-GAGR (n = 4 different embryo batches, p < 0.01 (F (5, 12) = 9.4859, p < 0.001, ANOVA)). F and G, primary cortical neurons (E17, DIV14) were pretreated with vehicle, 3 nm staurosporine, or 50 nm PD173074 for 2 h and treated with 1 μm mini-GAGR for 3 h prior to immunocytochemistry (Nrf2 (green; Alexa Fluor 488), βIII-tubulin (red; Alexa Fluor 594), DAPI). F, the fluorescence intensities of nuclear Nrf2 in images were quantified using Metamorph to calculate the average intensity ± S.E. of nuclear Nrf2 staining for bar graphs (n = 100–123 cells): control versus mini-GAGR, Stau, Stau + mini-GAGR, PD, PD + mini-GAGR (p < 0.001); mini-GAGR versus Stau + mini-GAGR, PD + mini-GAGR (p < 0.001) (F(5, 877) = 137.67, p < 0.001, ANOVA). *, p < 0.05; **, p < 0.01; ***, p < 0.001, one-way ANOVA and Bonferroni's multiple-comparison test). Data are expressed as mean ± S.E. (scale bar, 30 μm). (Of note, because the total number of measurements per condition was over 100, scatter plots were not used for graphs.)

