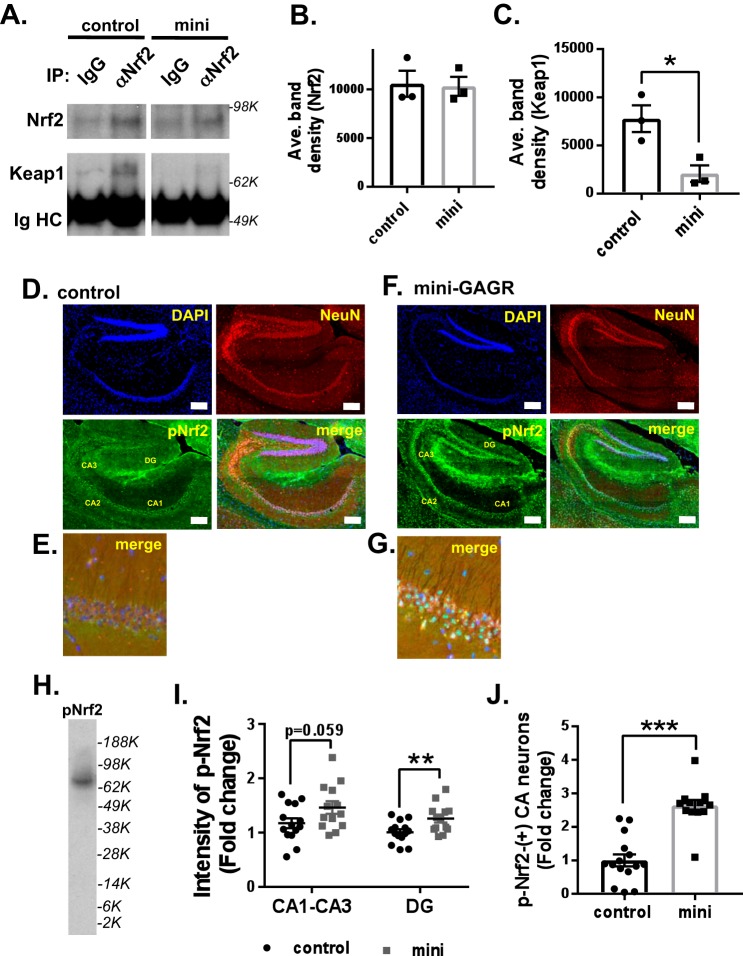
Figure 9.
Mini-GAGR reduces the interaction between Keap1 and Nrf2 and increases p-Nrf2 in hippocampal neurons in 12-month-old female 3xTg-AD mouse brains. A, the brain cortex cytosols from 3xTg-AD mice treated with either vehicle or 100 nmol of mini-GAGR for 20 days were used for co-IP using control IgG or anti-Nrf2 IgG. Precipitated Nrf2 and Keap1 were detected by immunoblotting. The band densities of precipitated Nrf2 and Keap1 were quantified by ImageJ to obtain average density ± S.E. (error bars) for bar graphs. B, Nrf2 (80 kDa): control versus mini-GAGR. C, Keap1 (70 kDa): control versus mini-GAGR (n = 3 animals/treatment; *, p < 0.05). D and F, the hippocampal sections of 3xTg-AD mice treated with either vehicle (D) or 100 nm mini-GAGR (F) were stained with antibodies to NeuN (red; Alexa Fluor 594), and p-Nrf2 (green; Alexa Fluor 488) along with DAPI (blue) (scale bar, 250 μm). E and G, magnified images of the immunostained hippocampal CA1 regions of 3xTg-AD mice treated with either vehicle (E) or 100 nm mini-GAGR (G) (scale bar, 50 μm). H, mouse cortical neurons treated with 1 μm for 3 h were used to confirm the specificity of anti-p-Nrf2 antibody. I, bar graphs show the -fold changes of intensities of p-Nrf2 staining in hippocampal CA1-CA3 and DG regions of 3xTg-AD mice treated with either vehicle or 100 nm mini-GAGR (n = 6 animals (14 sections)/treatment, p = 0.059; **, p < 0.01). J, bar graphs show the -fold changes of p-Nrf2–positive hippocampal CA1–CA3 and DG regions of 3xTg-AD mice treated with either vehicle or 100 nm mini-GAGR (n = 6 animals (14 sections)/treatment; ***, p < 0.001). *, p < 0.05; **, p < 0.01; unpaired t test, two tailed). Data are expressed as mean ± S.E.

