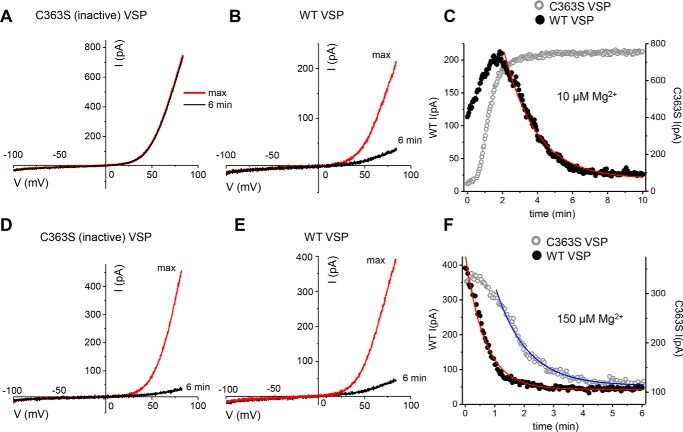
Figure 1.
Native TRPM7 channel currents in WT- and C363S VSP–expressing HEK cells. A, B, D, and E, TRPM7 current–voltage relations with 10 μm (A and B) and 150 μm (D and E) free internal Mg2+ in WT (B and E) and C363S (A and D) CiVSP-expressing cells. C and F, time courses of current development and reduction with internal 10 μm and 150 μm Mg2+. In this and subsequent figures (except for Figs. 7 and 8), filled and open symbols represent current amplitudes measured in cells expressing WT and C363S VSP, respectively. The graphs in A–F were obtained from the same cells. The declining current amplitude was fitted with a single exponential decay function (C and F). The membrane potential between ramps was held at −60 mV.

