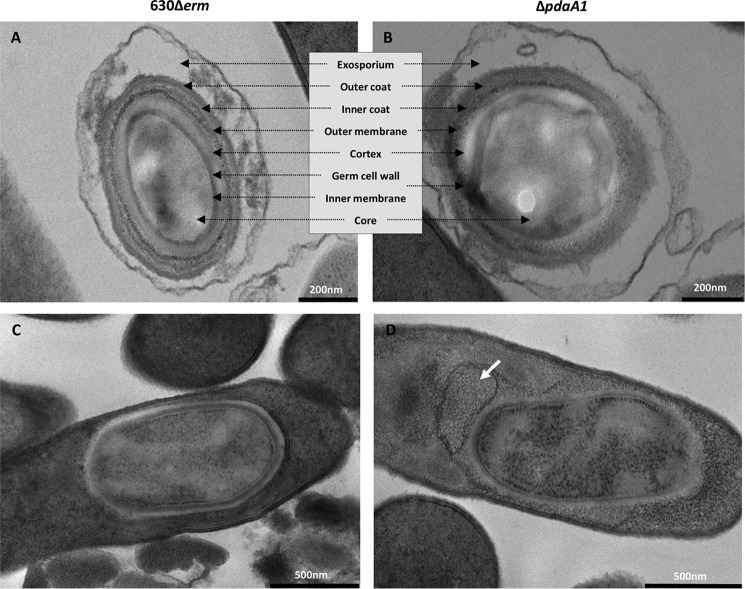
Figure 3.
pdaA1 mutant spore morphology. EM of 630Δerm spores (A) and endospores (C) was compared with ΔpdaA1 mutant spores (B) and endospores (D). The spore layers identified are indicated in the inset between A and B. The legends are indicated by the bars in the bottom right corner, representing 200 nm for the spores and 500 nm for the endospores. The white arrow indicates detached structures.

