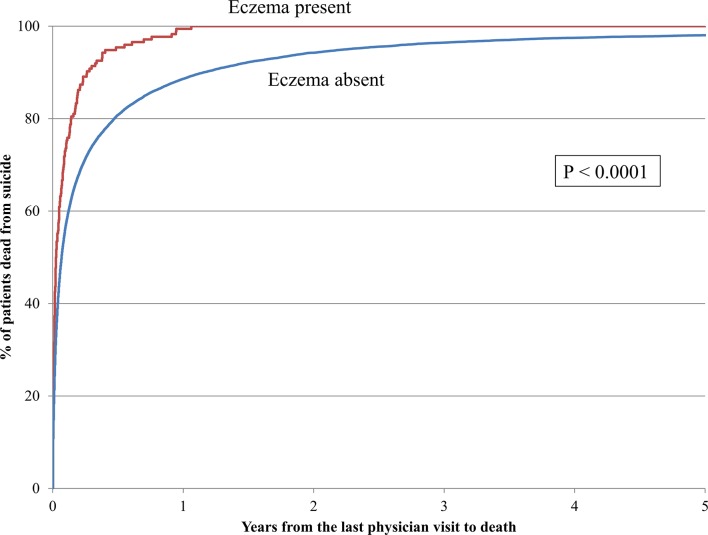
Figure 2.
Time from the most recent physician visit to suicide. Kaplan-Meier curve shows the time between the last physician visit and subsequent death from suicide (n=18 441). The x-axis shows the time in years lapsed between the most recent physician visit and the date of death. The y-axis shows the per cent of patients dead from suicide. The red line represents patients with persistent eczema. The blue line represents patients without persistent eczema. Statistical significance was based on the logrank test. Main findings show that patients with persistent eczema were more likely to see a physician in close proximity to their death.

