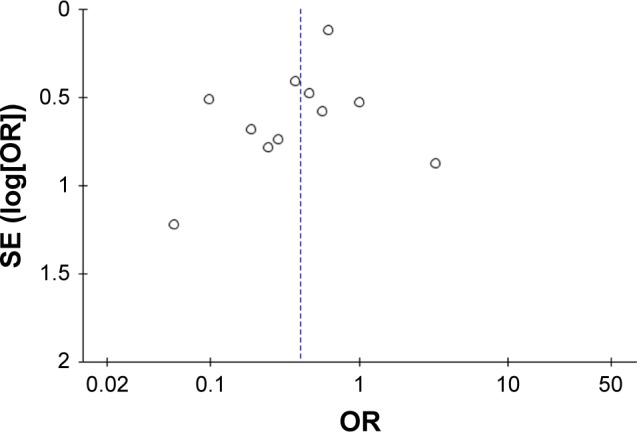
Figure 10.

Funnel plots illustrating meta-analysis of the total number of patients with one or more exacerbations after treatment with macrolides compared with the control.
Abbreviation: SE, standard error.

Funnel plots illustrating meta-analysis of the total number of patients with one or more exacerbations after treatment with macrolides compared with the control.
Abbreviation: SE, standard error.