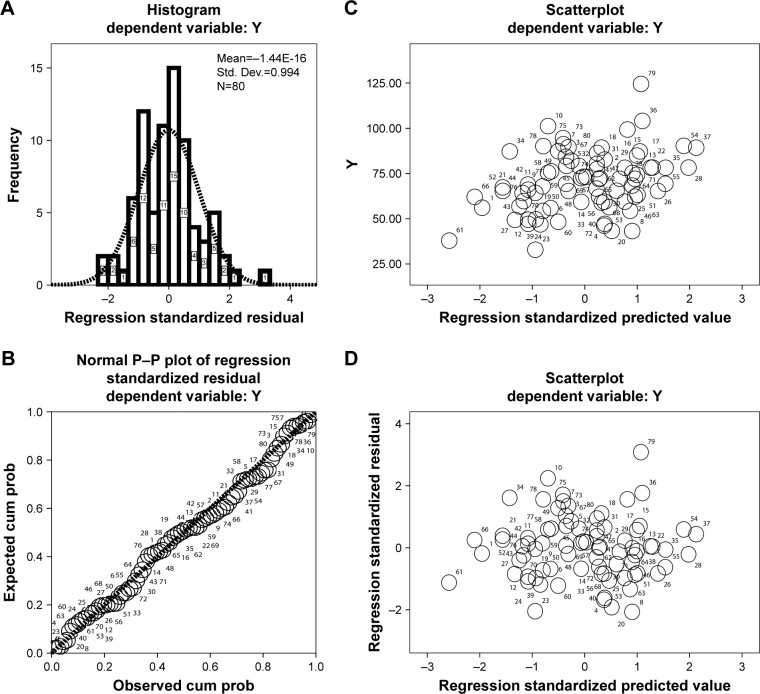
Figure 3.
Relationship between serum levels of HIF-1α and IL-19 in stable COPD patients.
Notes: (A) The histogram of normal curve showed that the normalized residuals are normal distributions (P>0.05). (B) The cumulative probability plot of the observations suggested that the two variables have a feature of normal distribution (P<0.05). (C) The dependent variable is approximately linear with the standardized predictive value, indicating that HIF-1α and IL-19 have a linear correlation (P>0.05). (D) The vast majority of normalized residuals did not exceed 3, suggesting no specific value was found.
Abbreviations: cum prob, cumulative probability; HIF-1α, hypoxia-inducible factor 1 alpha.

