
FIGURE 9:
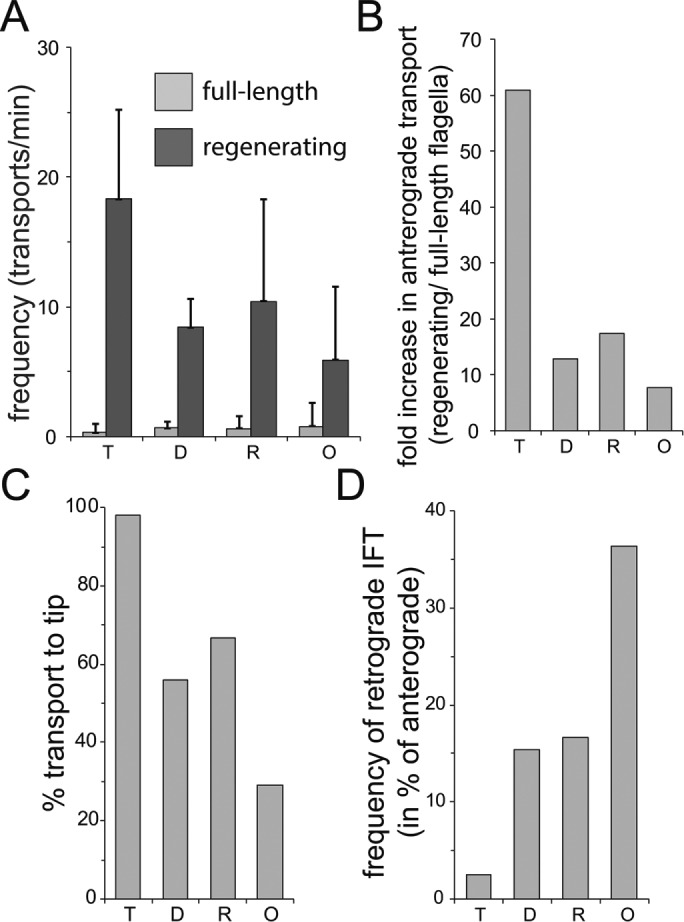
Axonemal proteins show distinct transport characteristics. Analysis of transport data for GFP-tagged tubulin (T), DRC4 (D), RSP4 (R), and IC2 (O). (A) Frequency of anterograde transport in full-length and regenerating flagella. (B) Ratio of the anterograde transport frequencies between regenerating and full-length flagella. (C) Share of transports that move processively from the flagellar base to the tip. The data for tubulin (T) are in parts based on regenerating flagella because its transport frequency is low in full-length flagella. (D) Frequency of retrograde transports expressed in % of the frequency of anterograde transports.