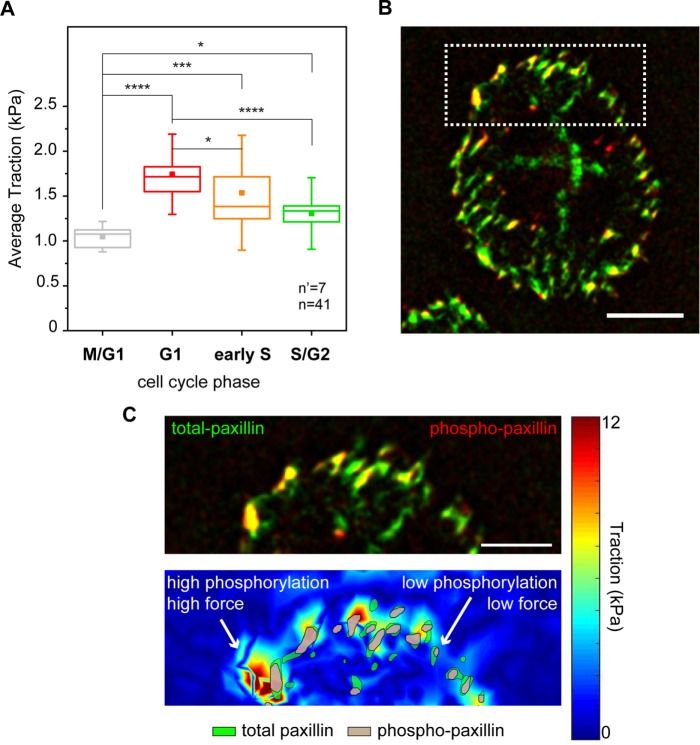
FIGURE 2:
Combined analysis of forces and focal adhesion maturation. (A) Cell cycle–dependent variation of traction forces transmitted to the substrate in fixed samples. *p < 0.05, ***p < 0.001, ****p < 0.0001. n = number of cells and n’ = number of independent experiments. (B) Basal distribution of total (green) and phosphorylated (red) paxillin signals obtained from immunostaining. (C) Corresponding map of actuating stresses (top panel). Magnification of the cell periphery (bottom panel), including a group of individual focal adhesions. Green area outlines the total paxillin profile, and gray area outlines phosphorylated paxillin regions.

