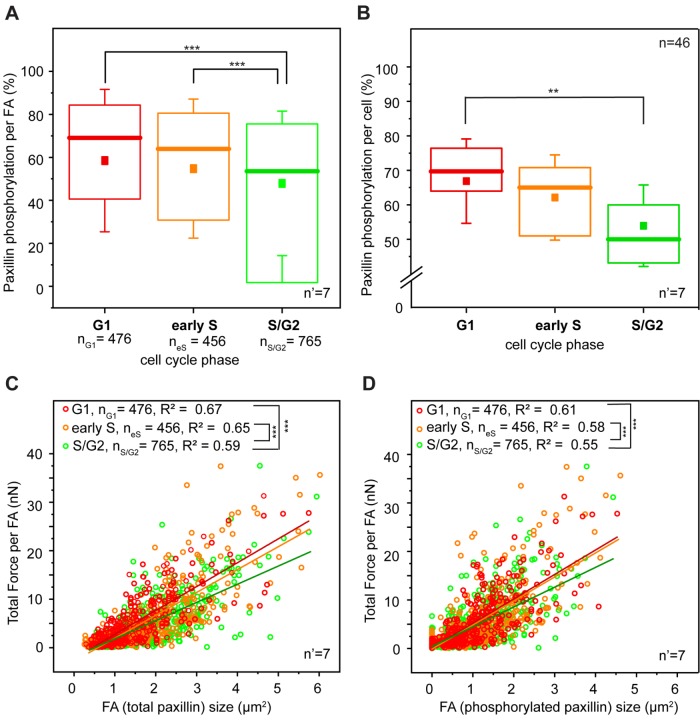
FIGURE 3:
Paxillin phosphorylation and force transmission. (A) Cell cycle–dependent variation of paxillin phosphorylation at focal adhesion sites. (B) Global variation of paxillin phosphorylation during the cell cycle progression of HeLa Fucci2 cells. **p < 0.01, ***p < 0.001. Correlation between force transmitted by individual focal adhesions and corresponding total focal adhesion size (C) and size of phosphorylated paxillin signal (D). Red, yellow, and green dots represent individual focal adhesions detected in G1, early S, and S/G2 cells, respectively. Lines of corresponding colors represent the linear fit to each data set. For panels A, C, and D, n = number of individual focal adhesions from seven independent experiments. For panel B, n = number of cells and n’ = number of independent experiments.

