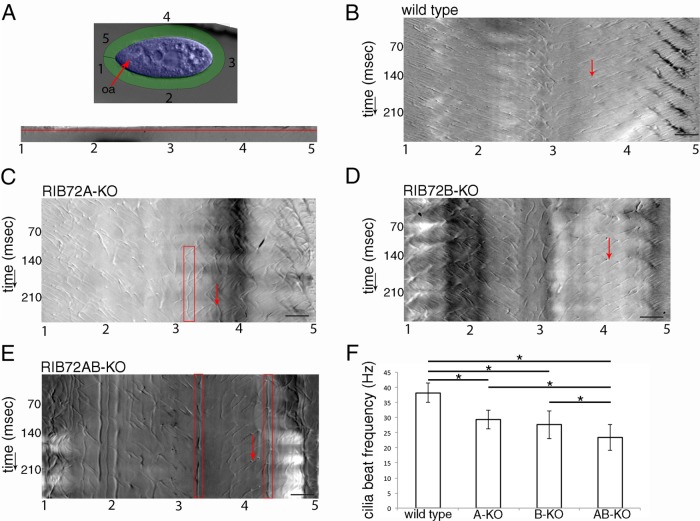
FIGURE 4:
Chronographs based on high-speed video imaging show that loss of either RIB72A or RIB72B or both proteins strongly affects the motility of cilia. (A) Outline of the image analysis workflow, based on Funfak et al. (2015) as applied here to Tetrahymena (see Supplemental Figure S2 for details). As shown in the top panel, the first frame of a video was used to mark the cell body (blue) and cilia (green) regions. Numbers correspond to the positions along the cell circumference starting at the cell’s anterior tip and going around the cell in a counterclockwise direction. The bottom panel shows a single frame of a movie of an extracted and unwrapped cilia region. Numbers 1–5 correspond to the positions marked around the cell circumference as shown in the top panel. The red line shows the position which was plotted over time to produce the chronograph seen in B. (B–E) Chronographs of the ciliary zones from wild-type (B) (Supplemental Video S1), single (C, D) (Supplemental Videos S2 and S3) and double-knockout cells (E) (Supplemental Video S4). The numbers on the x-axis correspond to the positions around the cell circumference as indicated in A; the y-axis represents time. Red arrows show examples of single beat duration measurements as distances between two consecutive diagonal gray-scale lines representing the same cilium in consecutive beat cycles. Note the presence of stalled or pivoting cilia indicated by red boxes in C and E. (F) Average beat frequencies in the wild-type (38.1 + 3.2 Hz, n cilia = 45, n cells = 9), RIB72A-KO (29.3 + 3.1 Hz, n cilia = 48, n cells = 8), RIB72B-KO (27.6 + 4.6 Hz, n cilia = 64, n cells = 9), and RIB72AB-KO cells (23.3 + 4.3 Hz, n cilia = 50, n cells = 8) cells. Error bars represent standard deviations, and asterisks indicate statistical significance at p < 0.001 (one-way ANOVA). Abbreviations: oa, oral apparatus. Scale bars are 10 microns.

