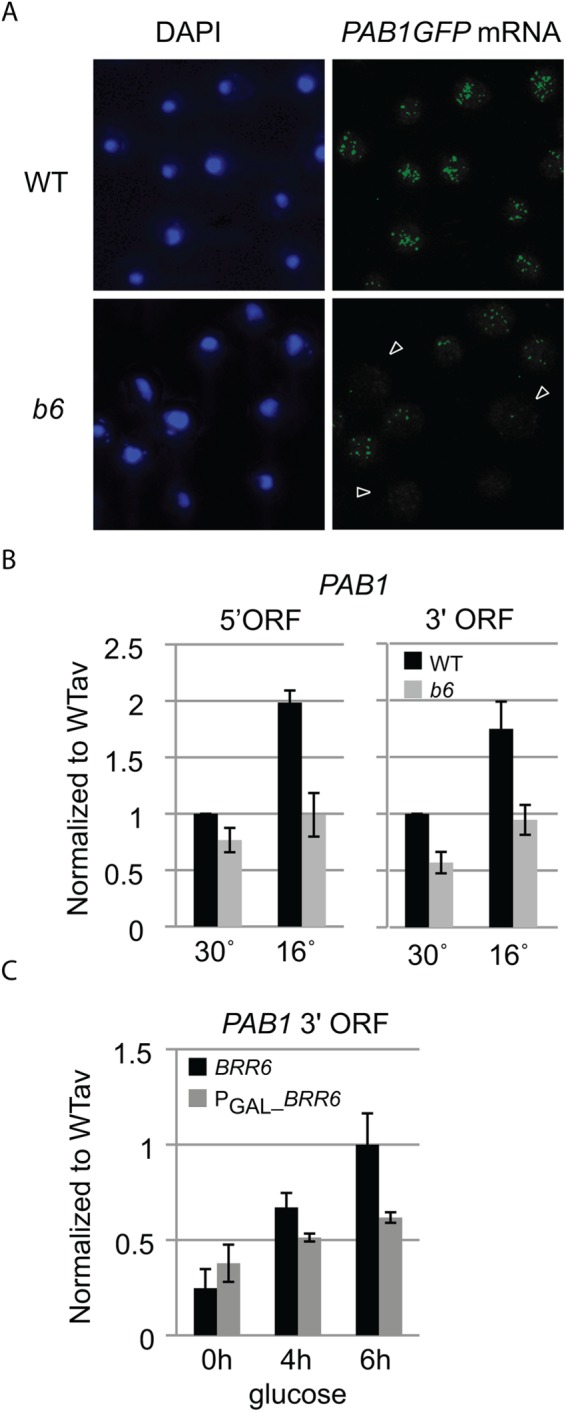
FIGURE 2:

brr6-1 decreases PAB1 transcript levels. (A) Single-molecule FISH detecting PAB1GFP mRNA in fixed isogenic WT (wild-type, yDBK165) and b6 (brr6-1, yDBK166) cells. Nucleus is detected by DAPI staining. Arrows indicate cells with little PAB1GFP RNA signal. Untagged control is shown in Supplemental Figure S2. (B) DN9 primed RT-qPCR detection of PAB1 5′ and 3′ ORF transcripts in total RNA prepared from WT (wild type, yDBK165) and b6 (brr6-1, yDBK166) cells grown at 30°C or shifted for 3 h to 16°C. (C) RT-qPCR detection of PAB1 3′ transcripts from BRR6 (yDBK155) and PGAL_BRR6 (yDBK192) cells following a time course of glucose repression. RT-qPCR data were normalized against a Cryptococcus RNA control (see Materials and Methods) and expressed relative to an averaged wild-type sample. Error bars (SEM) reflect four biological replicates.
