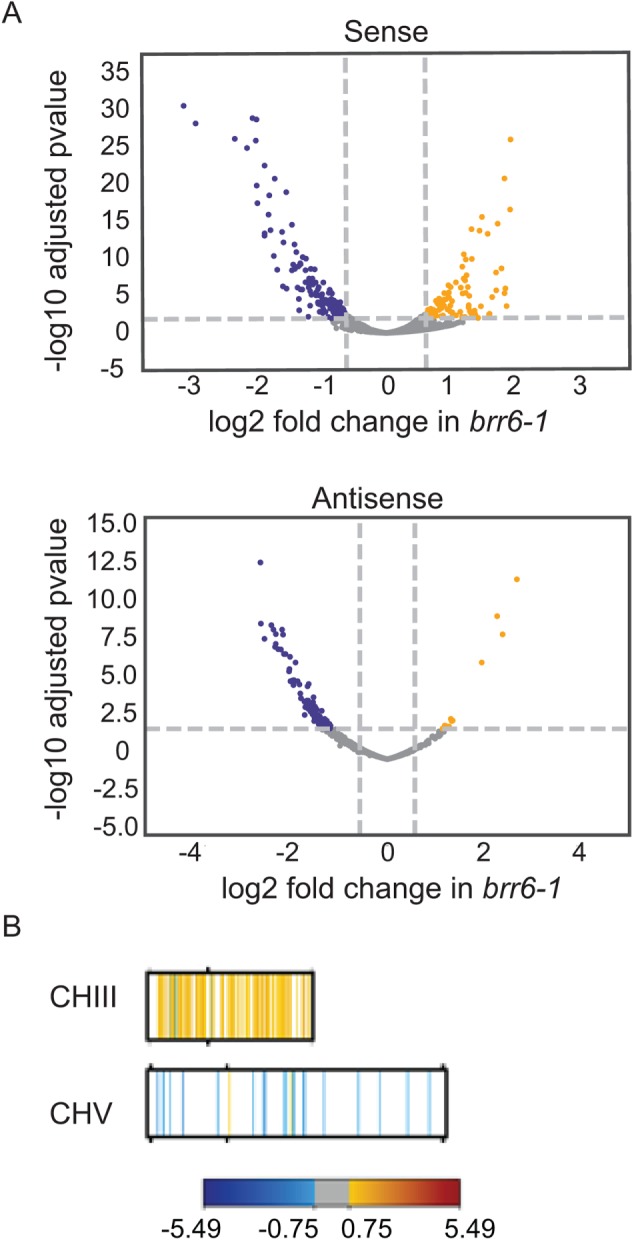
FIGURE 6:

RNAseq analysis detects genomewide expression changes and CHIII disomy. (A) Volcano plots showing distribution of fold sense and anti-sense changes and adjusted p values in brr6-1(yDBK168) relative to wild-type (yPH399) cells following 2 h galactose induction (blue, fold decreases; yellow, fold increases; gray, changes between ± 0.75 log2 fold). Genes showing significant changes in galactose and glucose are listed in Supplemental Tables 3 and 4. (B) Mapping of genes showing altered sense reads in brr6-1 (galactose) along CHIII and CHV (for other chromosomes and glucose results see Supplemental Figure S5, A and B).
