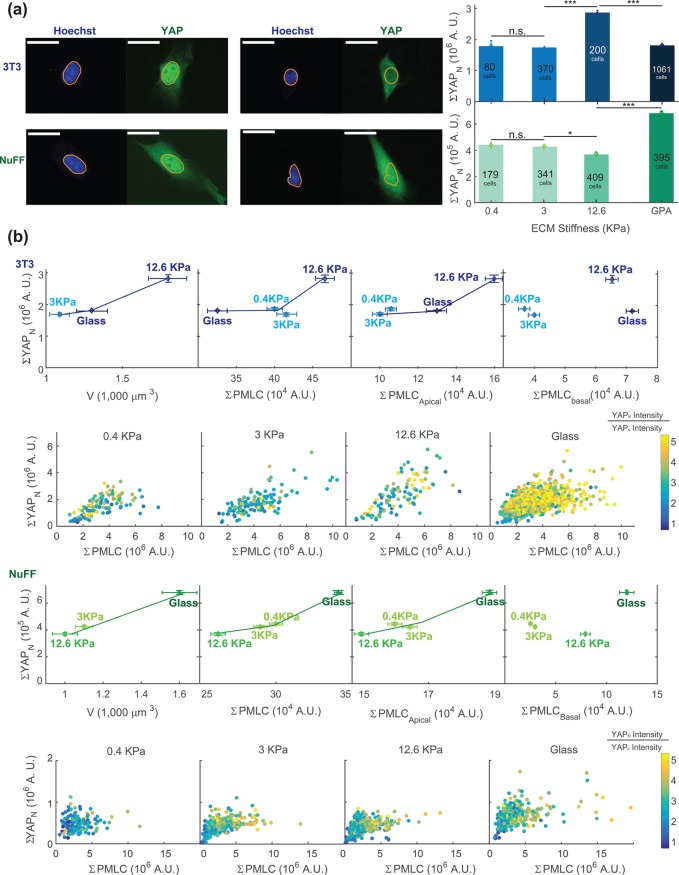
FIGURE 4:
Cell volume is correlated with nuclear YAP/TAZ level in 3T3s and NuFFs. (a) Immunofluorescence widefield images with YAP in green and DNA in blue. The DNA channel is used to mask the nuclear region. The total nuclear YAP (ΣYAPN) is obtained from epifluorescence images for different stiffnesses. (b) The total average nuclear YAP is plotted vs. the average measured cell volume, average total pMLC level, and apical and basal pMLC levels. The individual cell data are also plotted in panels below and color-coded by the nuclear YAP intensity/cytoplasmic YAP intensity ratio. At both the single-cell and ensemble levels, higher nuclear YAP is correlated with higher total pMLC. Higher nuclear YAP is also correlated with larger cell volume and higher apical pMLC, even though NuFFs and 3T3s display opposing trends as functions of substrate stiffness. Nuclear YAP is not correlated with basal pMLC. For NuFFs, nuclear YAP seems to plateau at large ΣpMLC, suggesting that nuclear YAP level reaches a maximum even as pMLC level is increasing. This suggests that there is another signal limiting nuclear YAP levels in NuFFs. Note that in both 3T3s and NuFFs, the nuclear-to-cytoplasmic YAP concentration ratios are generally higher than 1. Visually, nearly all cells appear to have significant nuclear YAP. (Scale bar = 10 μm. All error bars represent standard error. Statistical significance: ***p < 10–6; *p < 0.01; n.s.: p > 0.05. Number of cells for epifluorescence imaging: for 3T3s: N = 80 on 0.4 kPa, N = 370 on 3 kPa, N = 200 on 12.6 kPa, and N = 1061 on collagen-coated glass; for NuFFs: N = 179 on 0.4 kPa, N = 341 on 3 kPa, N = 409 on 12.6 kPa, and N = 395 on collagen-coated glass.)

