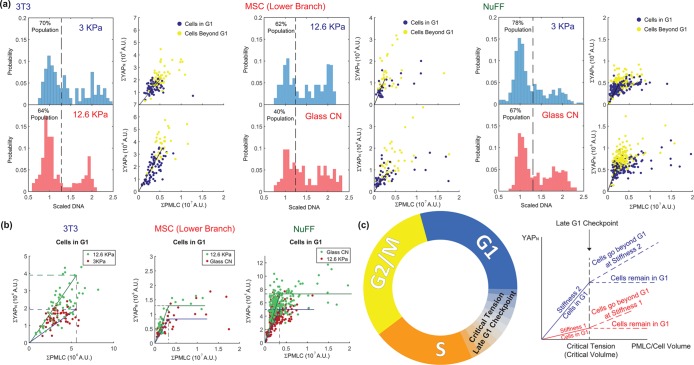
FIGURE 6:
Nuclear YAP and pMLC relation suggests a late G1 checkpoint based on cell tension. (a) Two stiffness conditions with the greatest difference in average cell volume are selected for 3T3s, MSCs, and NuFFs. The DNA histogram (left) is shown together with the total nuclear YAP vs. the total cell pMLC level (right). Cells are colored by their DNA content, with G1 cells identified as cells with DNA content below the dashed line in the DNA histogram (1.25 in the scaled DNA level). Cells beyond G1 have higher levels of nuclear YAP and pMLC. The rate of nuclear YAP and pMLC increase, however, varies with condition and cell type. (b). When cells in G1 under different conditions are compared, we observe that nuclear YAP rises with pMLC in G1 until a critical pMLC level is reached, suggesting a checkpoint based on cell tension. For 3T3s, cells proceed to S after the critical level of pMLC and nuclear YAP continues to rise with pMLC. For NuFFs and the MSC lower-branch populations, cells in G1 can continue to increase in pMLC and cell size, but the nuclear YAP level plateaus after the critical level of pMLC. (c) G1–S transition checkpoint based on cell tension. Nuclear YAP increases with increasing pMLC until a common critical tension level is reached, at which the cell transitions from G1 to S. If cells continue to grow in G1, nuclear YAP does not increase after the critical tension, but plateaus. These cells are presumably arrested in G1.

