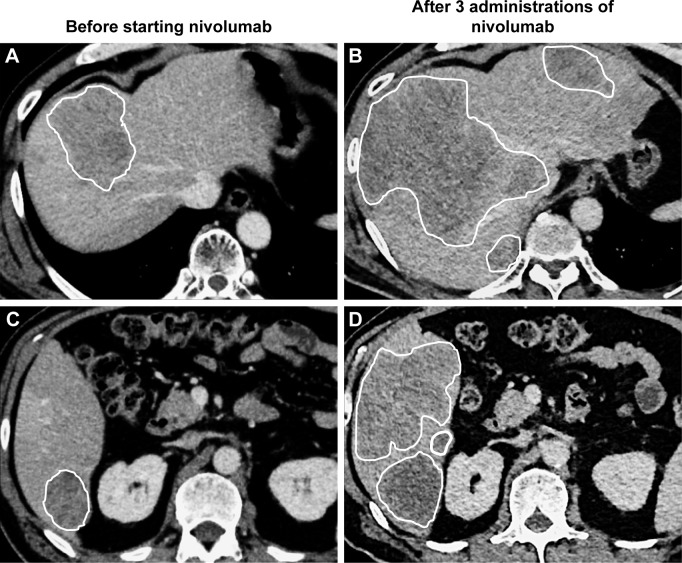
Figure 2.
CT imaging of hyper-progression.
Notes: (A, C) Representative CT imaging before nivolumab treatment. (B, D) CT evaluation after three cycles of nivolumab showed remarkable enlargement of liver metastatic lesions, indicating a fast cancer progression. White line shows margins of liver metastases.

