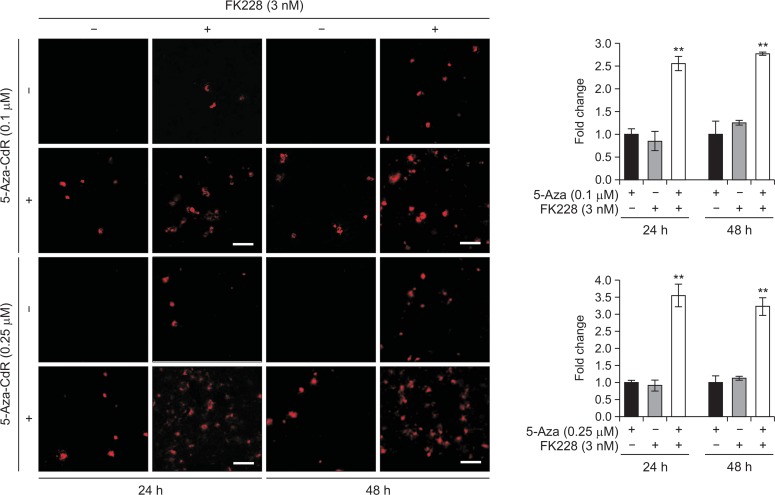
Fig. 2.
Zta induction after treatment with 5-Aza-CdR and/or FK228 in SNU-719 cells. Immunofluorescence was used to measure Zta. Representative fluorescence images are shown using anti-Zta primary antibody (1:40) after 24 h and 48 h of drug treatment. Bars, 100 μm. The data are expressed as relative fold change to control, 5-Aza-CdR single treatment. Data are presented as the mean ± SD from three independent experiments. ** indicates synergistic effects.

