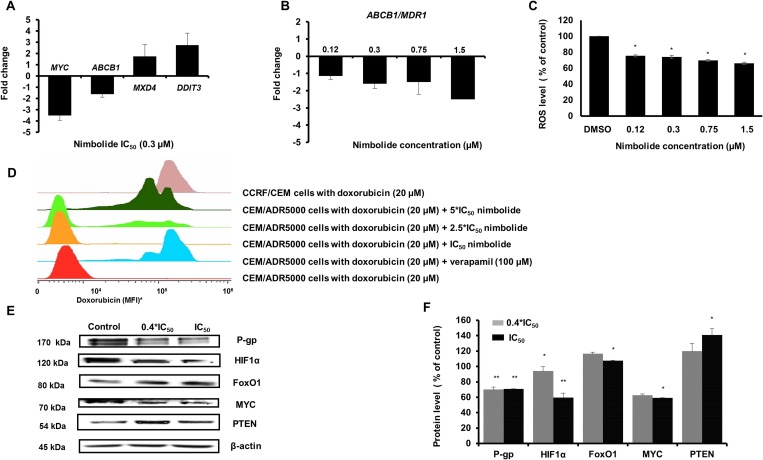
Figure 4.
(A) The effect of nimbolide IC50 on MYC, ABCB1, MXD4, and DDIT3 expression levels. Strong correlation between microarray data and qPCR was confirmed with R-value = 0.98 (Table 3). (B) The effect of different concentrations of nimbolide (0.4*IC50, IC50, 2.5*IC50 and 5*IC50) on the expression of ABCB1/MDR1. (C) Significant reduction of reactive oxygen species in CEM/ADR5000 cells after treatment with different concentrations of nimbolide. The results show mean values ± SD of three independent experiments. (*p < 0.05, compared to DMSO control cells). (D) The uptake of 20 μM doxorubicin was measured after 24 h in the presence of different concentrations of nimbolide and compared to doxorubicin uptake in CCRF-CEM. Verapamil 100 μM, a known P-glycoprotein inhibitor was used as a positive control. (*MFI, mean fluorescence intensity). (E and F) The effect of nimbolide on the protein expression levels for P-glycoprotein, HIF1α, FoxO1, MYC and PTEN in CEM/ADR5000 cells. The bands were normalized to β-actin and the mean values ± SD are shown in the results. (*p < 0.05, **p < 0.01compared to DMSO control cells).

