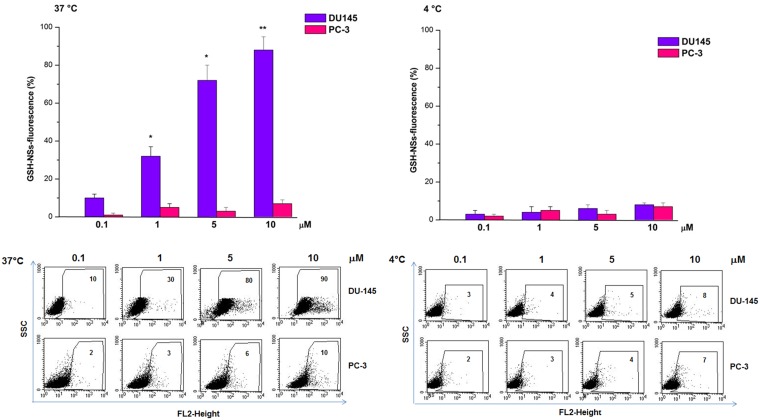
Figure 10. Flow cytometry analysis of the uptake of the GSH/pH-NS by prostate cancer cells.
DU-145 or PC-3 cells treated with the GSH/pH-NS at 37°C (left panel) or 4°C (right panel). The data are expressed as the mean ± SEM for four independent experiments (**p < 0.01, *p < 0.05 compared to controls, paired T-test). Fluorescence activated cell sorting plots represent a single experiment.

