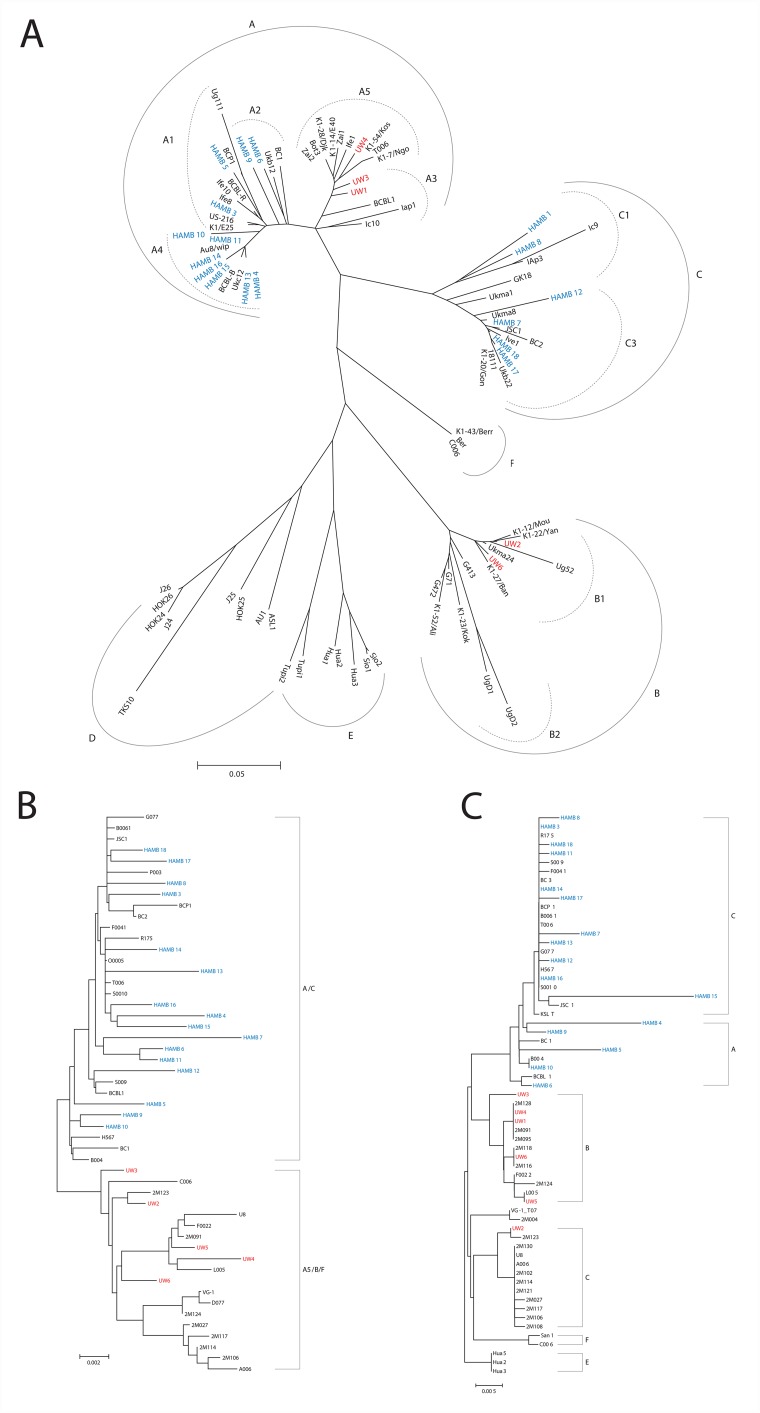
Figure 1.
(A) K1 Radial Phylogenetic tree. The Neighbor-Joining method was used to infer the evolutionary history. Nucleotide sequences were converted to amino acid prior to analysis. The phylogenetic tree analysis involved 89 amino acid sequences including current study participants and representative references from GenBank. All positions containing gaps and missing data were eliminated. There were a total of 147 positions in the final dataset. Subtypes are as indicated and are consistent with previous reports. Evolutionary analyses were conducted in MEGA6. (B) MicroRNA Cluster Phylogenetic tree. The microRNA cluster region phylogenies were determined using bootstrap neighbor-joining analysis with 100 replicates. The analysis involved 52 nucleotide sequences. There were a total of 2495 positions in the final dataset. Evolutionary analyses were conducted in MEGA6. (C) T0.7 Neighbor-joining tree: The evolutionary history was inferred using the Neighbor-Joining bootstrap analysis using 100 replicates. The subtype nomenclature is consistent with that established for the KSHV K12/T0.7 gene region. The analysis involved 64 nucleotide sequences from current study samples and GenBank references of appropriate subtypes. The final dataset included 530 positions. Evolutionary analyses were conducted in MEGA6.

