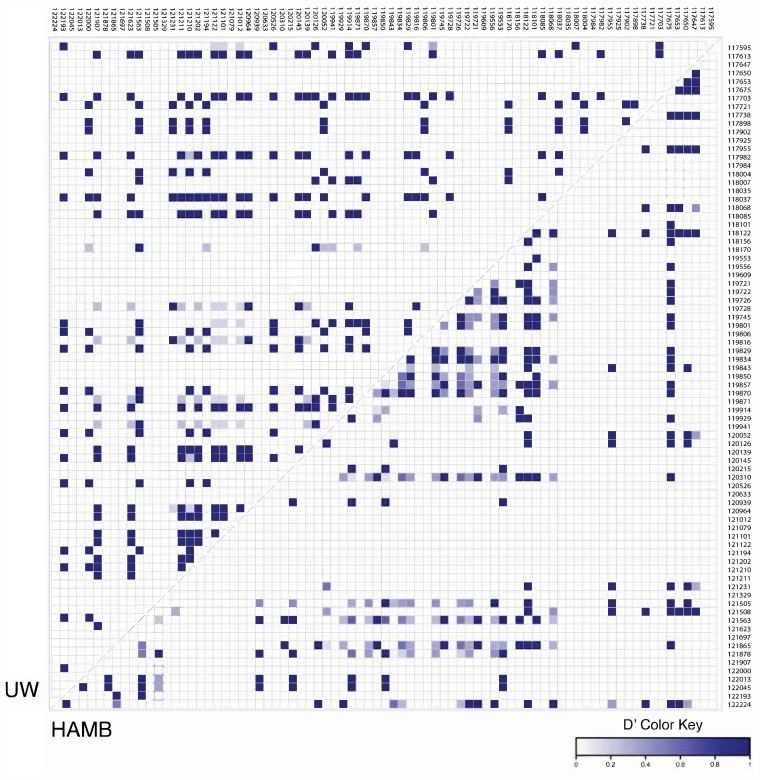
Figure 3. Pairwise linkage disequilibrium (LD) plots of UW and HAMB patients from the KSHV K12 and microRNA cluster region.
Localization of microRNAs genes is indicated on the top and the side, with nucleotide positions based on BCBL-1 genomic coordinates. A strong LD (D’) is indicated by a darker shade of blue (D’ close to 1) whereas white represents no LD (D’ = 0). The LD was calculated as Tajima's D’ with VCFtools 0.1.15. A total of 79 of the original 102 sites were kept after filtering.

