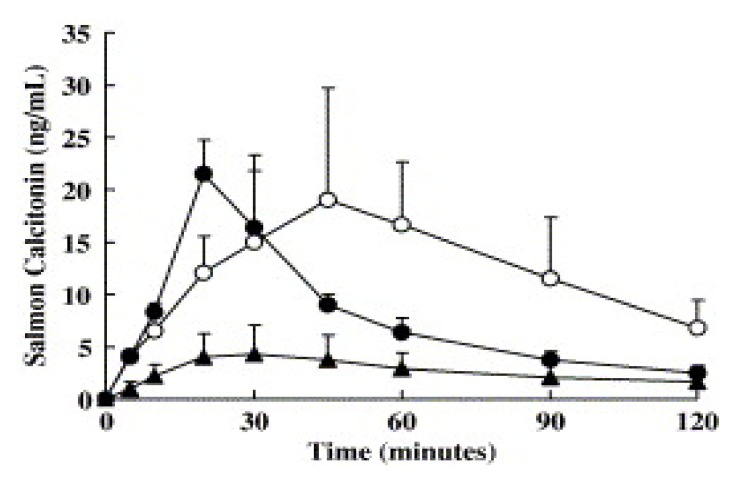
Figure 5.
Comparison of plasma concentration–time profiles following nasal administration of liquid and powder formulations, and subcutaneous administration (○) of 0.3 mg of sCT in dogs. ▲; Formulation-L (sCT in saline), ●; Formulation-PN (powder formulation with NAC and ethylcellulose). Data represent mean plasma concentrations of sCT ± S.D. (n = 4) [reprinted with permission from Ref. [74], copyright Elsevier (2006)].

