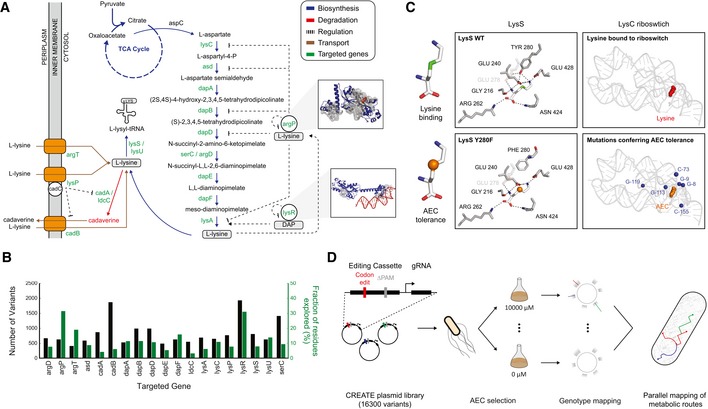
Overview of the lysine metabolism in E. coli. The arrows are color coded according to the different metabolic categories, as defined in the figure legend. Genes targeted in the library are highlighted in green. The insets represent examples of library designs for two targeted proteins, with the targeted residues included inside the gray surface representation.
For each targeted gene, the number of variants (black bars, left y‐axis) and the fraction of the single substitution sequence space (green bars, right y‐axis) are plotted. The total library size across all genes sums to 16,300 variants.
Description of the two main mechanisms of AEC toxicity. The structural differences between canonical lysine and AEC are shown in the left, with the orange sphere highlighting the sulfur group present in AEC. Lysine binding is shown in the top panels, and AEC is shown in the bottom panels. Mutations described to confer AEC resistance are highlighted in the bottom panels.
Workflow of the strategy to map trajectories of AEC resistance using CREATE. Briefly, designed cassettes were cloned, miniprepped, and transformed into strains expressing Cas9 and the lambda red machinery. The library culture was grown for 8 h in LB media with proper antibiotics, washed with PBS, and inoculated into M9 minimal media containing the AEC selective pressure and antibiotics. An aliquot was stored for initial plasmid barcode sequencing counts. After growth, cells were harvested for deep sequencing of the plasmid barcodes, which were used to map the enrichment scores of the designed mutants.

