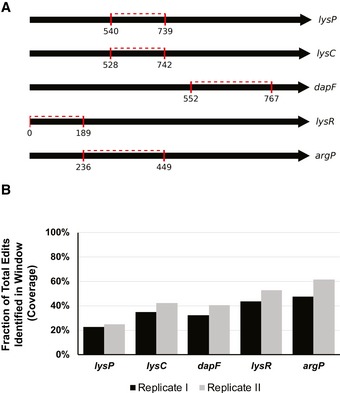
Figure EV2. Deep sequencing of selected genomic regions.

- Regions sequenced in the selected genes. The red marks denote the start position and end positions, with the dashed line highlighting the sequenced genomic region.
- Plot of fraction of designs that could be identified in the sequenced regions (coverage, y‐axis) for each sequenced gene (x‐axis).
