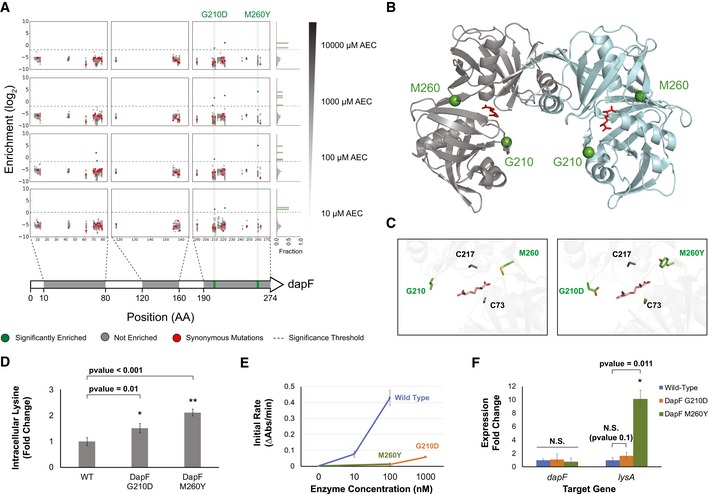
Mapping of enrichment across the positions targeted in dapF. The gray regions in the gene cartoon at the bottom highlight the windows containing targeted residues, with the enrichment map shown above for increasing AEC concentrations. Enrichments are color coded according to the legend at the bottom. A histogram plot of enrichment is shown at the right.
Structure of the DapF dimer (PDB ID: 4IJZ) with the G210 and M260 sites highlighted in green. Diaminopimelate binding is shown in red.
Zoom in the catalytic site highlighting the G210 and M260 sites relative to the catalytic cysteines. The G210D and M260Y substitutions are shown in the right panel.
Absolute quantification of intracellular lysine concentration in wild‐type and the reconstructed DapF mutants. Quantification was performed using LC‐MS, as described in the methods section. n = 3. Error bars show mean value ± SD. A two‐sample Student's t‐test assuming unequal variances was performed to calculate statistical significance. Concentrations are reported as fold change relative to the wild‐type control samples.
DapF assay showing kinetics of the wild‐type, G210D and M260Y mutants. Assay was performed as described in the methods section. n = 5. Error bars show mean value ± SD.
Differential gene expression quantified via qPCR for the dapF and lysA genes on a WT, DapF G210D, and DapF M260Y backgrounds. Error bars represent 95% confidence intervals. A two‐tailed Student's t‐distribution was used to calculate P‐values, which were adjusted using the Benjamin–Hochberg statistical method for false discovery rates.

