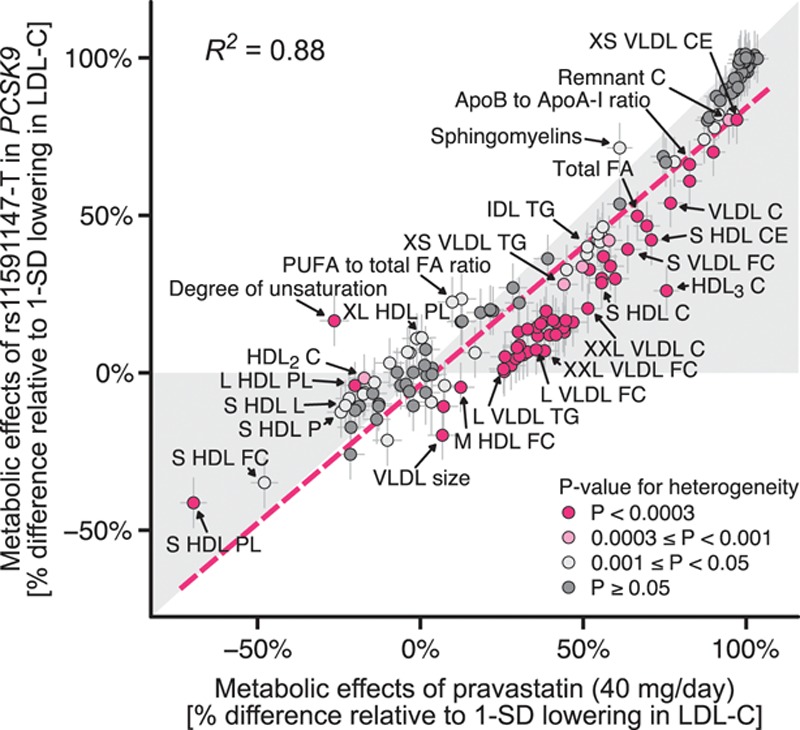
Figure 2.

Consistency of metabolic effects of statin treatment and PCSK9 rs11591147-T. The effect size of each metabolic measure is given with 95% confidence intervals in gray vertical and horizontal error bars. Color coding for the metabolic measure indicates the P value for heterogeneity between statin therapy and PCSK9 rs11591147-T. R2 = 0.880 indicates goodness of fit (correlation squared). The red dashed line denotes the linear fit for the consistency of the metabolic effects (slope of this line = 0.879). C indicates cholesterol; FA, fatty acids; FC, free cholesterol; HDL, high-density lipoprotein; IDL, intermediate-density lipoprotein; LDL, low-density lipoprotein; PL, phospholipids; PUFA, polyunsaturated fatty acids; TG, triglycerides; and VLDL, very-low-density lipoprotein. A full list of metabolite names is given in Table II in the online-only Data Supplement.
