Figure 5.
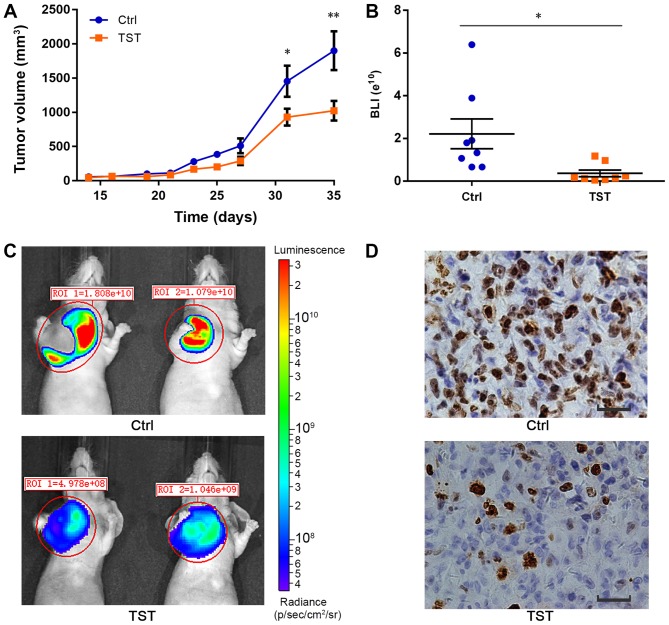
TST suppresses the proliferation of MDA-MB-231 xenografts in vivo. (A) Tumor volumes were estimated in MDA-MB-231 xenografts. n=8. (B) Quantification of BLI signal intensity demonstrated a significant decrease in animals treated with Thiostrepton (orange spot; n=8) compared with the control animals (blue spot; n=8). (C) Representative BLI images of untreated and TST-treated MDA-MB-231 xenografts on day 35. Colors in the BLI images correspond with signal strength/intensity: red, strong; cyan, intermediate; and blue, weak. Colored scale bar represents photons/sec/cm2/steradian. *P<0.05. (D) Immunohistochemistry for proliferation marker Ki-67 in tumor sections. Scale bar, 100 µm. *P<0.05, **P<0.01. TST, Thiostrepton; BLI, bioluminescent; ROI, region of interest; Ctrl, control.

