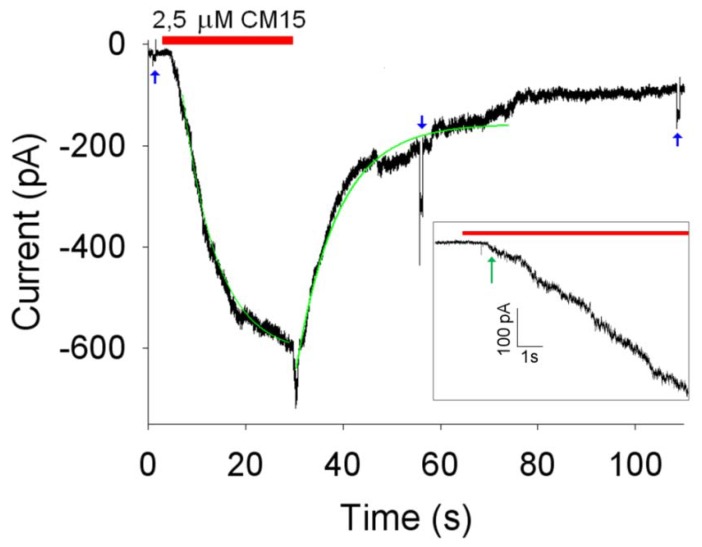
Figure 3.
Kinetics of OS membrane permeabilisation induced by 2.5 μM concentration of CM15. Red bar indicate the timing of the peptide application and withdrawal; green traces are exponential fittings of the activation and deactivation phases of the current (τa ≈ 7 s; τd ≈ 8.5 s; Imax ≈ -580 pA; Vh = -20 mV); blue arrows are 700 ms voltage steps of -10 mV superimposed to Vh to measure Rm (that was 1 GΩ before peptide application and 200 MΩ within 50 s after peptide removal from the external perfusion solution). Inset: initial activation phase of the current at high resolution; red bar indicate the timing of peptide application (Da ≈ 1.0 s, indicated by the green arrow; Dd ≈ 0.5 s).

