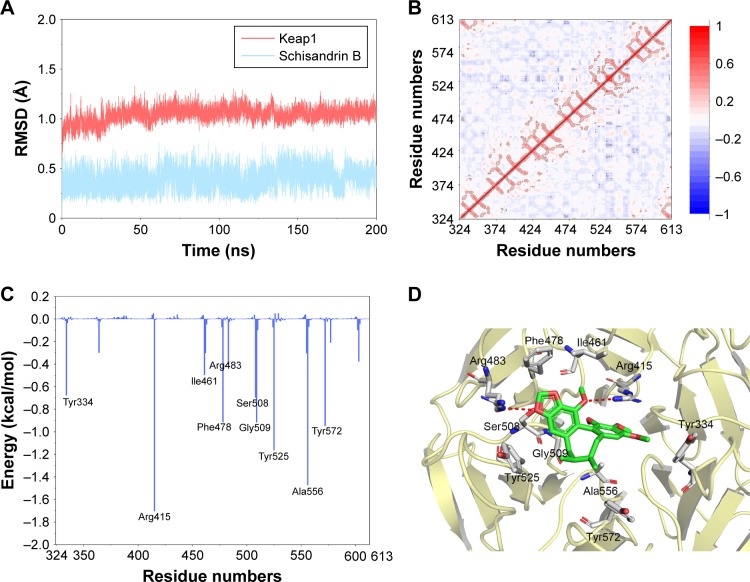
Figure 5.
Structural and energetic analysis of SchB to the binding site of Keap1 by MD simulation.
Notes: (A) RMSD curves for the 200 ns MD simulation. (B) Dynamic cross-correlations of residue fluctuations from MD simulations. (C) Per residue contribution of binding energy of the Keap1–SchB complex. To get a clear view, only residues in the top ten contributed are shown. (D) Structural analysis of the ten most contributed residues of Keap1 to SchB.
Abbreviations: MD, molecular dynamics; RMSD, root-mean SD; SchB, schisandrin B.

