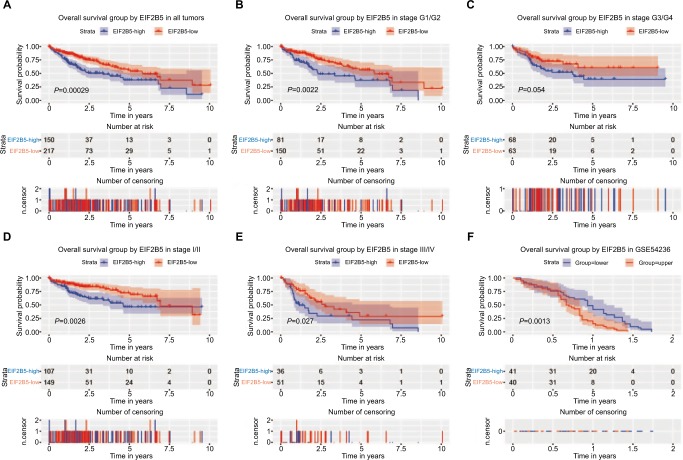
Figure 3.
Survival analysis of EIF2B5 expression in terms of overall survival.
Notes: Kaplan–Meier curves produced survival analysis (A) and subgroup analysis of histological grade (G1/G2 and G3/G4) (B and C) and clinical stage (I/II and III/IV) (D and E). Validation group of survival analysis in GSE54236 (F).

