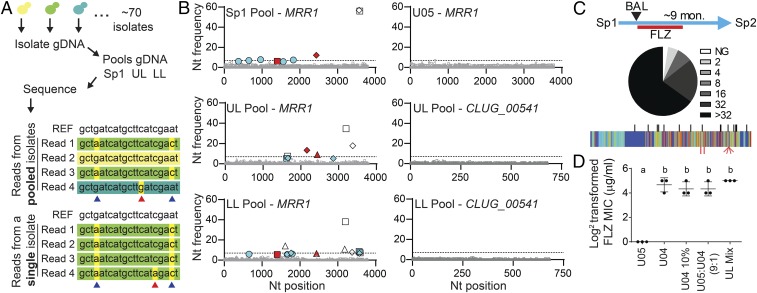
Fig. 4.
Small subpopulations of FLZR isolates can alter the FLZ resistance profile of the population. (A) Schematic for the creation of pooled isolate DNA. Equivalent amounts of DNA were obtained from individual isolates then combined before sequencing. Individual genomes were not uniquely marked. A representation of Illumina reads from pooled and single isolate sequencing is shown in comparison with the reference sequence (REF) from ATCC 42720. Differences in read color represent sequences that originated from different isolates; nucleotides highlighted in yellow differ from the reference. SNPs (blue arrows) are largely invariant (common across >95% of reads) in single-isolate sequence data but present at a lower frequency in pooled sequencing data. We determined the threshold for SNP detection in pools based on the rate of sequencing errors (red arrows) in single-isolate WGS data. (B) Nucleotide frequency of nonreference alleles for MRR1 from pooled (Sp1, UL, and LL) and single isolates (U05) WGS and CLUG_00541 from pooled (UL and LL) WGS. The frequencies of the nonreference nucleotides are plotted at every position (reference set to zero); positions that differ from the reference but are shared among the clinical isolates are not shown due to scale. Nucleotides are represented as follows: A (square), C (triangle), G (circle), and T (diamond). Nucleotide frequencies shown in gray are present at less than 5%, the threshold at which we are unable to distinguish between low-abundance alleles and sequencing error. Open symbols represent previously identified SNPs that correlate with FLZ MIC ≤ 8 μg/mL, red filled symbols represent previously identified SNPs that correlate with a FLZ MIC ≥ 16 μg/mL, and blue filled symbols represent SNPs that were not detected in any of the 20 single-isolate genomes. The dashed line at 7% represents the threshold for novel SNP detection; only blue nucleotides above 7% were counted as novel SNPs, of which there were four. (C) Lowest inhibitory concentration of FLZ for each Sp2 (n = 83) isolate, from no growth, NG, to >32 μg/mL FLZ (Sp1 data shown in SI Appendix, Fig. S5A) and schematic showing sample acquisition timeline including 4 mo of FLZ treatment and 5 mo off antifungals. Novel SNPs in MRR1 identified in Sp2 isolates (red, Bottom) are plotted on the sequence conservation heat map from Fig. 2, with SNPs and INDEL locations identified in Sp1, UL, and LL isolates marked in black (Top) for reference. (D) Log2-transformed FLZ MICs (micrograms per milliliter) measured at 24 h for U05 and U04 alone, U04 alone at 10% the normal starting concentration (U04 10%), a 9:1 mixture of U05:U04, and a mixture of equivalent amounts of all 74 UL isolates. Mean ± SD from three independent replicates is shown, a-b ****P < 0.0001.

