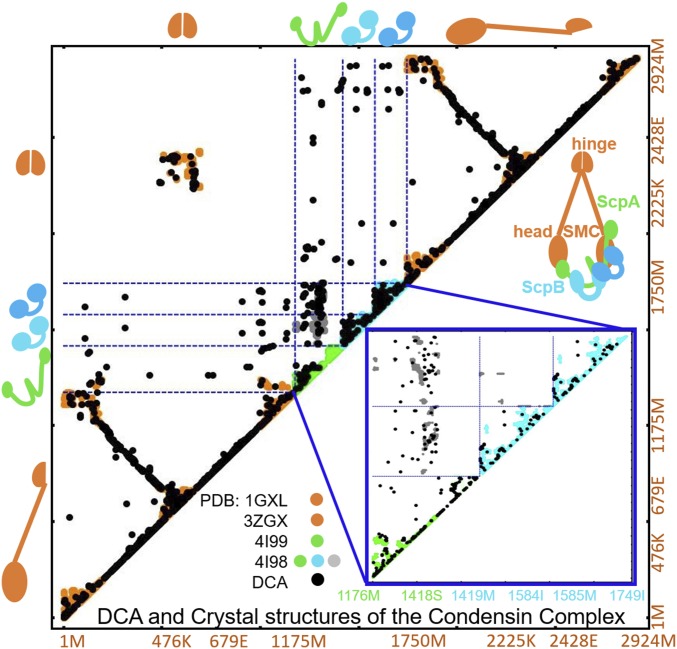
Fig. 2.
Overview of all crystallographic structural data for the condensin complex together with coevolutionary information. Residue–residue contacts map is shown for the DCA-derived contacts (represented by black dots) together with the contacts from available crystal structures obtained from PDB for the SMC–ScpA–ScpB–ScpB–SMC system. The residue indices for the whole system and their respective amino acid identities of each protein subunit are shown on the x and y axes. Orange, green, and cyan represent crystallographic results of SMC, ScpA, and ScpB subunits, respectively (27, 28). In the intraprotein regions, wherever data are available, the agreement between crystallography and coevolutionary contacts is evident. A magnified view of the ScpA–ScpB–ScpB crystallographic (ScpA, ScpB, and ScpAB interprotein region shown in green, cyan, and gray, respectively) and predicted DCA contacts (represented in black) are shown in the bottom right corner in a blue box.

