Fig. 3.
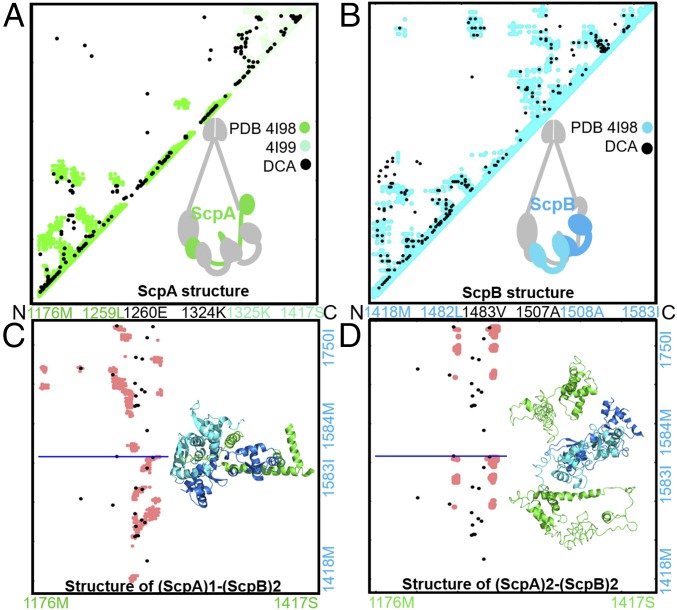
The ScpAB system favors a single ScpA subunit accommodating two ScpB proteins. Contact maps show a comparison between DCA-derived contacts and crystallographic data (A and B) as well as between DCA contacts and simulation-derived contacts (C and D). DCA contacts are shown in black. Crystallographic contacts are shown in green and cyan for the ScpA and ScpB subunits, respectively. Contacts from MD simulation are shown in pink (C and D). The residue indices and corresponding amino acid identities are labeled along the axes. (A) DCA recapitulates available crystallographic data for ScpA subunit (28). (B) DCA recapitulates available crystallographic data for ScpB subunit (28). (C) Comparison between simulated data from MD and DCA contacts for the stoichiometry (ScpA)1–(ScpB)2. Residue indices are shown on the axis, with the horizontal blue line separating the contact maps of the two ScpB proteins. It is evident that DCA-derived contacts are consistent with the simulated structure of either the two copies of ScpB. (D) Comparison between simulated data from MD and DCA contacts for the stoichiometry (ScpA)2–(ScpB)2. Residue indices are shown on the axis, with the horizontal blue line separating the contact maps of the two ScpB proteins. This stoichiometry results in a simulated structure inconsistent with the DCA-derived coevolutionary contacts. The comparison between C and D strongly favors the (ScpA)1–(ScpB)2 stoichiometry vs. the (ScpA)2–(ScpB)2.

