Fig. 5.
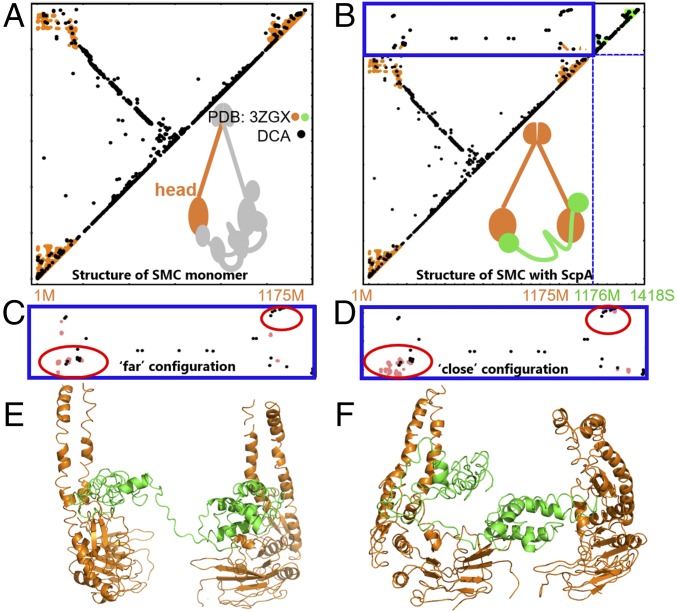
The SMC–kleisin system has several possible configurations. Contact maps show the comparison between the DCA contacts with crystallographic contacts (A and B) as well as the DCA contacts with simulation-derived contacts (C and D). SMC–ScpA interprotein contact domain is shown in blue border (B–D). DCA contacts are shown in black, crystallographic contacts are shown in orange and green, and MD simulations-derived contacts are shown in pink. (A) DCA recapitulates available crystallographic data for a single SMC head domain as well as for (B) a single SMC head domain (orange) with crystallographically determined contacts from a single ScpA (green) protein complex. (C–F) MD simulations reveal two alternative interfacial configurations between SMC heads and kleisin. One configuration in C and E shows the two heads relatively far from each other, while the other in D and F shows the two SMC heads closer together. (C) The interprotein contact map shows the comparison between simulated data from MD and DCA contacts for the “far” configuration. DCA contacts are satisfied in the bottom red circle. (D) The interprotein contact map shows the comparison between simulated data from MD and DCA contacts for the “close” configuration. Here, DCA contacts are satisfied in both top and bottom red circles. (E) A representative structure of the far configuration. SMC and ScpA are shown in orange and green, respectively. (F) A representative structure of the close configuration. SMC and ScpA are shown in orange and green, respectively. Our results demonstrate several alternative configurations for the SMC–kleisin system, suggesting overall dynamics of the condensin ring.

