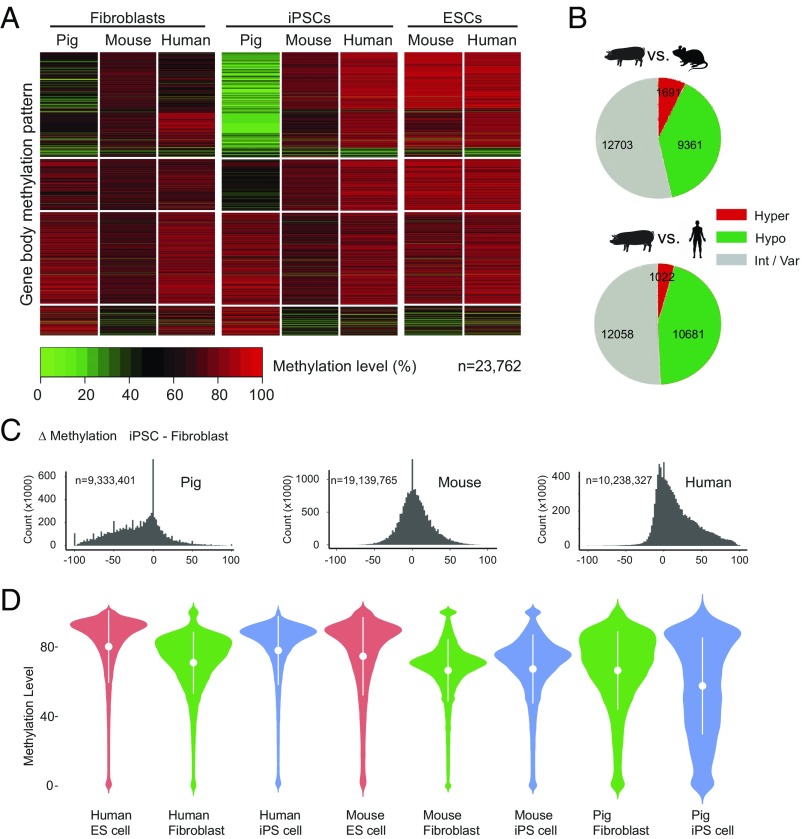
Fig. 2.
Pig iPSCs are reprogrammed differently and show genome-wide hypomethylation compared with mouse and human. (A) Clustered heat map to visualize the methylation pattern of the gene body for orthologous genes. Each line represents one orthologous gene; n indicates number of orthologous genes. (B) Pie charts showing the number of the gene body methylation types of orthologous genes in pig, mouse, and human iPSCs. The gene body methylation types are partitioned according to their status in pig iPSC: hypomethylated (pig iPSC–mouse iPSC ≤ −0.25), intermediate or variable (−0.25 < pig iPSC–mouse iPSC > 0.25), or hypermethylated (pig iPSC–mouse iPSC ≥ 0.25). (C) Histograms of methylation changes (Δ methylation = iPSC-fibroblast) for 100-bp tiles across pig, mouse, and human genomes. The genome was split into tiles of 100-bp length; n indicates number of tiles. (D) Violin plots for methylation level of all Ensembl genes in different cell types. The plots show the distribution for gene body methylation level of all genes in pig tissues. The methylation distribution difference is dramatically evened out after NT. The x axis represents the probability density of the data at each methylation level. The mean and SD are indicated by the white dots and error bars.

