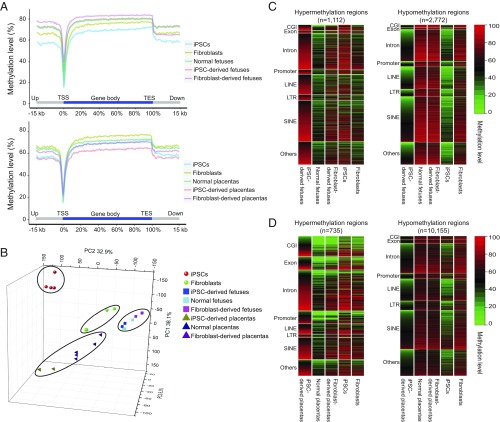
Fig. 3.
Key features of DMRs in iPSC-derived fetus/placenta vs. normal. (A, Upper) Averaged DNA methylation levels along the gene bodies, 15 kb upstream of the TSS, and 15 kb downstream of the transcription end sites (TES) of all Ensembl genes in the normal pig fetus, iPSC-derived pig fetus, and fibroblast-derived pig fetus. (Lower) Averaged DNA methylation levels along the gene bodies and 15 kb upstream of TSS and 15 kb downstream of TES of all Ensembl genes in normal, iPSC-derived placenta, and fibroblast-derived placentas. (B) PCA based on the gene methylation level of all WGBS samples. PCA 3D scatter plots were generated based on the gene body methylation of all genes in all porcine WGBS samples (four iPSCs, three fibroblasts, two iPSC-derived fetuses, two fibroblast-derived derived fetuses, three normal fetuses, two iPSC-derived placentas, two fibroblast-derived placentas, and three normal placentas). Of the total variance, 77.3% was explained by the first three PCs (PC1, 38.1%; PC2, 32.9%; PC3 6.3%). (C) Heat maps showing methylation levels of pig iPSC-derived fetus hypermethylation (Left) and hypomethylation (Right) DMRs across different genomic regions in the iPSC-derived fetus vs. normal fetus. Hypermethylated regions were strongly enriched in CG islands (P < 0.001, hypergeometric enrichment test). (D) Heat map of the methylation level of iPSC-derived placenta hypermethylation/hypomethylation DMRs among different genomic regions in iPSC-derived placentas vs. normal placentas; n indicates the number of DMRs. Hypermethylated regions were strongly enriched in CGIs (P < 0.001, hypergeometric enrichment test).

