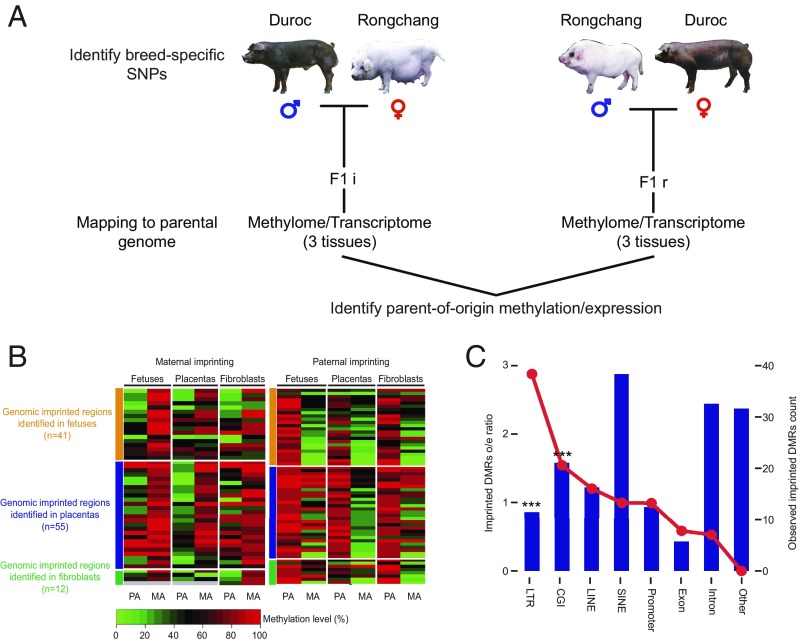
Fig. 4.
Identification of imprinted genes and imprinted DMRs. (A) Identification of parent-of-origin methylation. Tissue samples were collected from F1 offspring of reciprocal crosses between genetically distinct pig breeds. F1i: Duroc (PA) × Ronghcang (MA); F1r: Rongchang (PA) × Duroc (MA). DNA samples were subject to bisulfite sequencing, and the methylation level of parental alleles was distinguished by breed-specific SNPs. Parent-of-origin methylation was identified by identification of a reciprocal methylation bias on a parental allele. (B) Heatmap for the imprinted DMR in three tissues. MA, maternal allele; PA, paternal allele. Each tile indicates the average methylation level of the parental allele in the imprinted regions. Gray tiles indicate missing values. (C) Plot showing the distribution of all imprinted DMRs across different genomic features. The red line plot represents the imprinted DMRs observed/expected ratio (corresponding to the left y axis). The bar plot represents the counts of the observed imprinted DMRs in each genomic feature (corresponding to the right y axis). The imprinted DMRs include both candidate-imprinted DMRs identified in this study and homologous imprinted DMRs inferred from the mouse. The imprinted regions were strongly enriched in CGIs (P < 0.001, hypergeometric enrichment test). ***P < 0.001.

