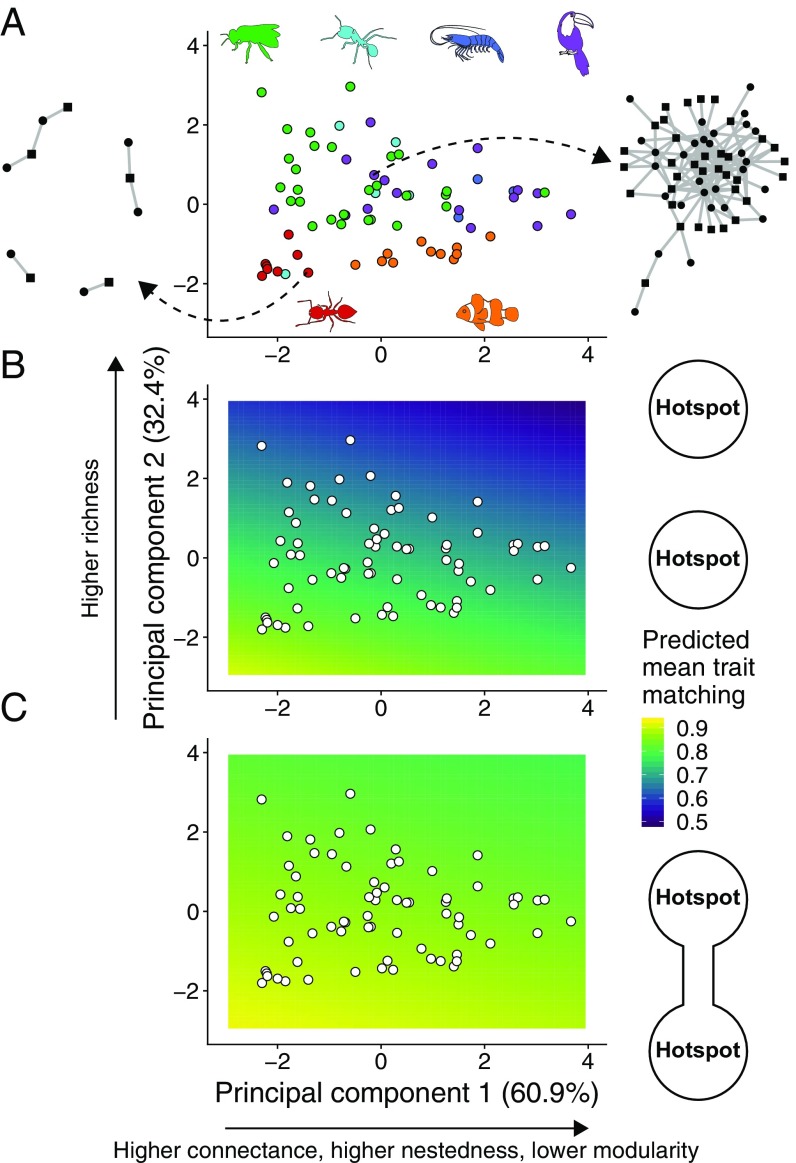
Fig. 3.
Network structure, gene flow, and the emergence of trait matching in mutualistic networks. (A) and of a PCA using four network structure metrics measured for our 72 empirical networks. accounted for 60.9% of all variation and was strongly correlated with connectance (0.56), nestedness (0.58), and modularity (−0.56). accounted for 32.4% of all variation and was strongly correlated with species richness (0.81). Network structure was highly variable, as illustrated by an ants–myrmecophytes (Left, network 14 in SI Appendix, Table S1) and a seed dispersal (Right, network 64 in SI Appendix, Table S1) network. Types of mutualism: green, pollination; cyan, ants–nectary-bearing plants; dark blue, marine cleaning; purple, seed dispersal; red, ants–myrmecophytes; orange, anemones–anemonefishes. (B and C) Predicted mean trait matching at the hotspot () for a linear model with and as explanatory variables and trait matching from simulations as the response variable (white points are the networks in A). (B) Species-poor, modular networks favored the emergence of trait matching in isolated hotspots (, , n = 100 simulations per network). (C) The effect of network structure is reduced when the two hotspots are connected by gene flow, and species-rich, nested networks may also favor high trait matching (, , n = 100 simulations per network). Simulation parameters as in Fig. 2.

