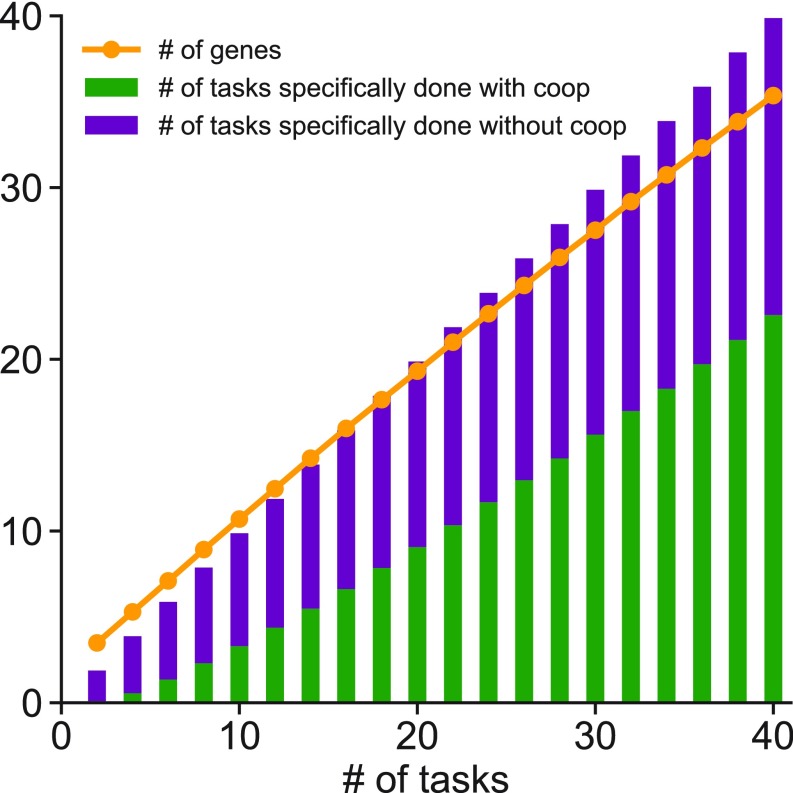
Fig. 2.
WCI evolve as organisms become more complex. This figure shows the variation of the average number of genes in organisms and the number of tasks specifically done via WCI between gene products as the number of tasks required for an organism to function properly increases (or organisms become more complex). The number of tasks performed by single gene products is also shown. When the number of tasks equals 10, 33% of tasks are done via WCI, and when the number of tasks equals 40, this proportion is 56%. Three characteristics describe the interaction characteristics of tasks and gene products.

